
Quick analysis: Everything is back up again
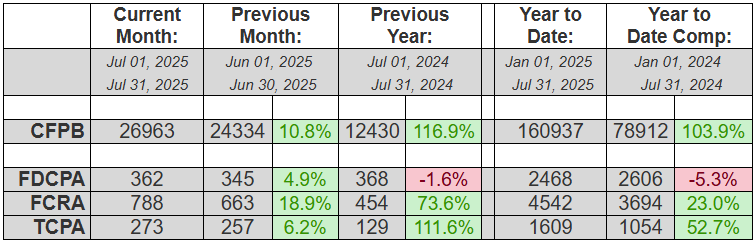
After a dip in most statute filings last month, everything is back up in July.
TCPA (+6.2%), FDCPA (+4.9%) and FCRA (+18.9%(!)) were all up for the month of July. YTD, TCPA (+52.7%) and FCRA (+23%) are both way up, while FDCPA (-5.3%) is the only one still lagging behind last year. But even that margin shrunk (by -.6%) last month, following a months-long pattern of getting smaller.
Meanwhile, CFPB complaints were up 10.8% for the month and up a whopping 103.9%(!) for the year so far.
In other news, putative class actions represented 3.3% of FDCPA, 72.5%(!) of TCPA and 1% of FCRA lawsuits filed last month. TCPA class actions are still extraordinarily high, historically speaking. About 45% of all plaintiffs who filed suit last month had filed at least once before. And finally, South Florida attorney Gerald Lane (from The Law Offices of Jibrael S. Hindi) continued for a sixth straight month to represent both the most consumers in last month (82) as well as YTD (439).
Complaint Statistics:26963 consumers filed CFPB complaints, and about 1131 consumers filed lawsuits under consumer statutes from Jul 01, 2025 to Jul 31, 2025.
- 26963 CFPB Complaints
- 362 FDCPA, 12 Class Action (3.3%)
- 273 TCPA, 198 Class Action (72.5%)
- 788 FCRA, 8 Class Action (1.0%)
Litigation Summary (scroll down for CFPB data):
- Of those cases, there were about 1131 unique plaintiffs (including multiple plaintiffs in one suit).
- Of those plaintiffs, about 508, or (45%), had sued under consumer statutes before.
- Combined, those plaintiffs have filed about 4586 lawsuits since 2001
- Actions were filed in 154 different US District Court branches.
- About 746 different collection firms and creditors were sued.
The top courts where lawsuits were filed:
- 79 Lawsuits: Georgia Northern District Court – Atlanta
- 72 Lawsuits: Florida Middle District Court – Tampa
- 61 Lawsuits: Illinois Northern District Court – Chicago
- 58 Lawsuits: California Central District Court – Western Division – Los Angeles
- 47 Lawsuits: California Central District Court – Southern Division – Santa Ana
- 45 Lawsuits: Florida Southern District Court – Miami
- 35 Lawsuits: California Southern District Court – San Diego
- 30 Lawsuits: Florida Southern District Court – Fort Lauderdale
- 29 Lawsuits: Florida Middle District Court – Orlando
- 27 Lawsuits: California Central District Court – Eastern Division – Riverside
The most active consumer attorneys were:
- Representing 82 Consumers: GERALD DONALD LANE
- Representing 46 Consumers: ZANE CHARLES HEDAYA
- Representing 41 Consumers: FAARIS KAMAL UDDIN
- Representing 23 Consumers: MARK A CAREY
- Representing 18 Consumers: ETHAN BRANDON BABB
- Representing 18 Consumers: SAMANTHA R WOOD
- Representing 17 Consumers: KYLE W SCHUMACHER
- Representing 16 Consumers: ANTHONY PARONICH
- Representing 13 Consumers: JONATHAN H YONG
Statistics Year to Date:
7640 total lawsuits for 2025, including:
- 2468 FDCPA
- 4542 FCRA
- 1609 TCPA
Number of Unique Plaintiffs for 2025: 6567 (including multiple plaintiffs in one suit)The most active consumer attorneys of the year:
- Representing 439 Consumers: GERALD DONALD LANE
- Representing 185 Consumers: ZANE CHARLES HEDAYA
- Representing 164 Consumers: FAARIS KAMAL UDDIN
- Representing 131 Consumers: OCTAVIO GOMEZ
- Representing 99 Consumers: ANTHONY PARONICH
- Representing 77 Consumers: JONATHAN ALEXANDER HEEPS
- Representing 77 Consumers: DAVID J PHILIPPS
- Representing 77 Consumers: TODD M FRIEDMAN
- Representing 75 Consumers: MARK A CAREY
——————————————————————————————————-
CFPB Complaint Statistics:There were 26963 complaints filed against debt collectors from Jul 01, 2025 to Jul 31, 2025.Total number of debt collectors complained about: 1114The types of debt behind the complaints were:
- 14504 I do not know (54%)
- 5191 Other debt (19%)
- 3466 Credit card debt (13%)
- 1008 Rental debt (4%)
- 990 Telecommunications debt (4%)
- 737 Medical debt (3%)
- 568 Auto debt (2%)
- 257 Payday loan debt (1%)
- 104 Federal student loan debt (0%)
- 87 Private student loan debt (0%)
- 51 Mortgage debt (0%)
Here is a breakdown of complaints:
- 11051 Attempts to collect debt not owed (41%)
- 7241 Written notification about debt (27%)
- 3752 False statements or representation (14%)
- 3615 Took or threatened to take negative or legal action (13%)
- 747 Communication tactics (3%)
- 364 Electronic communications (1%)
- 193 Threatened to contact someone or share information improperly (1%)
The top five subissues were:
- 6112 Debt is not yours (23%)
- 4560 Notification didnt disclose it was an attempt to collect a debt (17%)
- 4014 Debt was result of identity theft (15%)
- 3578 Attempted to collect wrong amount (13%)
- 3116 Threatened or suggested your credit would be damaged (12%)
The top states complaints were filed from are:
- 6130 Complaints: TX
- 2938 Complaints: FL
- 2088 Complaints: GA
- 1926 Complaints: CA
- 1254 Complaints: NC
- 1124 Complaints: IL
- 943 Complaints: NY
- 822 Complaints: PA
- 761 Complaints: VA
- 668 Complaints: LA
The status of the month’s complaints are as follows:
- 12629 In progress (47%)
- 11575 Closed with explanation (43%)
- 2432 Closed with non-monetary relief (9%)
- 306 Untimely response (1%)
- 21 Closed with monetary relief (0%)
This includes 26515 (98%) timely responses to complaints, and 448 (2%) untimely responses.