
Quick analysis: TCPA & CFPB Complaints Down, FDCPA & FCRA Complaints Up for October
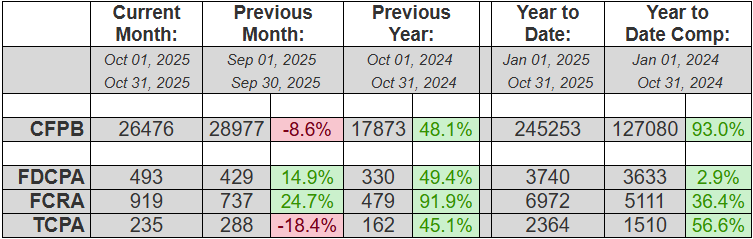
In a sign of the ongoing volatility of consumer complaints, TCPA (-18.4%) and CFPB (-8.6%) complaints were both down last month, after having been on a bit of a tear all year (+56.6% and +93% YTD, respectively). Meanwhile FDCPA (+14.9%) and FCRA (+24.7%) complaints were both up for the month and also for the year (+2.9% and +36.4% YTD, respectively). So everything is up YTD and it looks like it may end the year that way, unless FDCPA suits take a significant hit in Nov & Dec.
In other news, putative class actions represented 3.4% of FDCPA, 72.8%(!) of TCPA and 1.3% of FCRA lawsuits filed last month. TCPA class actions are still extraordinarily high, historically speaking. About 39% of all plaintiffs who filed suit last month had filed at least once before. And finally, South Florida attorney Gerald Lane (from The Law Offices of Jibrael S. Hindi) continued for a ninth straight month to represent both the most consumers in October (74) as well as YTD (664).
Complaint Statistics:
26476 consumers filed CFPB complaints, and about 1280 consumers filed lawsuits under consumer statutes from Oct 01, 2025 to Oct 31, 2025.
- 26476 CFPB Complaints
- 493 FDCPA, 17 Class Action (3.4%)
- 235 TCPA, 171 Class Action (72.8%)
- 919 FCRA, 12 Class Action (1.3%)
Litigation Summary (scroll down for CFPB data):
- Of those cases, there were about 1280 unique plaintiffs (including multiple plaintiffs in one suit).
- Of those plaintiffs, about 493, or (39%), had sued under consumer statutes before.
- Combined, those plaintiffs have filed about 11196 lawsuits since 2001
- Actions were filed in 170 different US District Court branches.
- About 725 different collection firms and creditors were sued.
The top courts where lawsuits were filed:
- 77 Lawsuits: Georgia Northern District Court – Atlanta
- 70 Lawsuits: California Central District Court – Western Division – Los Angeles
- 63 Lawsuits: Illinois Northern District Court – Chicago
- 46 Lawsuits: Florida Middle District Court – Tampa
- 37 Lawsuits: California Central District Court – Southern Division – Santa Ana
- 33 Lawsuits: Florida Southern District Court – Fort Lauderdale
- 31 Lawsuits: California Southern District Court – San Diego
- 30 Lawsuits: California Central District Court – Eastern Division – Riverside
- 28 Lawsuits: California Eastern District Court – Sacramento
- 27 Lawsuits: Florida Southern District Court – Miami
The most active consumer attorneys were:
- Representing 74 Consumers: GERALD DONALD LANE
- Representing 63 Consumers: JOSHUA BRANDON SWIGART
- Representing 62 Consumers: DANIEL GUINN SHAY
- Representing 61 Consumers: KATHERINE ANNE TUOHY
- Representing 17 Consumers: JENNA DAKROUB
- Representing 16 Consumers: OCTAVIO GOMEZ
- Representing 15 Consumers: ANGELA YU
Statistics Year to Date:
11329 total lawsuits for 2025, including:
- 3740 FDCPA
- 6972 FCRA
- 2364 TCPA
Number of Unique Plaintiffs for 2025: 9627 (including multiple plaintiffs in one suit)
The most active consumer attorneys of the year:
- Representing 664 Consumers: GERALD DONALD LANE
- Representing 225 Consumers: ANTHONY PARONICH
- Representing 223 Consumers: ZANE CHARLES HEDAYA
- Representing 181 Consumers: OCTAVIO GOMEZ
- Representing 179 Consumers: FAARIS KAMAL UDDIN
- Representing 112 Consumers: JONATHAN ALEXANDER HEEPS
- Representing 112 Consumers: DAVID J PHILIPPS
- Representing 104 Consumers: MARK A CAREY
——————————————————————————————————-
CFPB Complaint Statistics:
There were 26476 complaints filed against debt collectors from Oct 01, 2025 to Oct 31, 2025.
Total number of debt collectors complained about: 1122
The types of debt behind the complaints were:
- 15067 I do not know (57%)
- 5184 Other debt (20%)
- 3009 Credit card debt (11%)
- 871 Rental debt (3%)
- 808 Telecommunications debt (3%)
- 664 Medical debt (3%)
- 483 Auto debt (2%)
- 204 Payday loan debt (1%)
- 66 Federal student loan debt (0%)
- 61 Private student loan debt (0%)
- 59 Mortgage debt (0%)
Here is a breakdown of complaints:
- 8811 Attempts to collect debt not owed (33%)
- 6520 Took or threatened to take negative or legal action (25%)
- 6260 Written notification about debt (24%)
- 3622 False statements or representation (14%)
- 695 Communication tactics (3%)
- 337 Electronic communications (1%)
- 231 Threatened to contact someone or share information improperly (1%)
The top five subissues were:
- 5960 Threatened or suggested your credit would be damaged (23%)
- 4925 Debt is not yours (19%)
- 3615 Notification didnt disclose it was an attempt to collect a debt (14%)
- 3461 Attempted to collect wrong amount (13%)
- 3038 Debt was result of identity theft (11%)
The top states complaints were filed from are:
- 4334 Complaints: TX
- 2816 Complaints: CA
- 2793 Complaints: FL
- 2218 Complaints: GA
- 1092 Complaints: NC
- 1021 Complaints: IL
- 981 Complaints: VA
- 909 Complaints: NY
- 906 Complaints: PA
- 828 Complaints: AZ
The status of the month’s complaints are as follows:
- 14266 Closed with explanation (54%)
- 8694 In progress (33%)
- 2967 Closed with non-monetary relief (11%)
- 527 Untimely response (2%)
- 22 Closed with monetary relief (0%)
This includes 25769 (97%) timely responses to complaints, and 707 (3%) untimely responses.