
Quick analysis: Everything Down in August; Most Still Up YTD
Similar to April of this year, we are seeing a month where everything dipped for the month, but not enough to change the trajectory of the upward year to date trends.
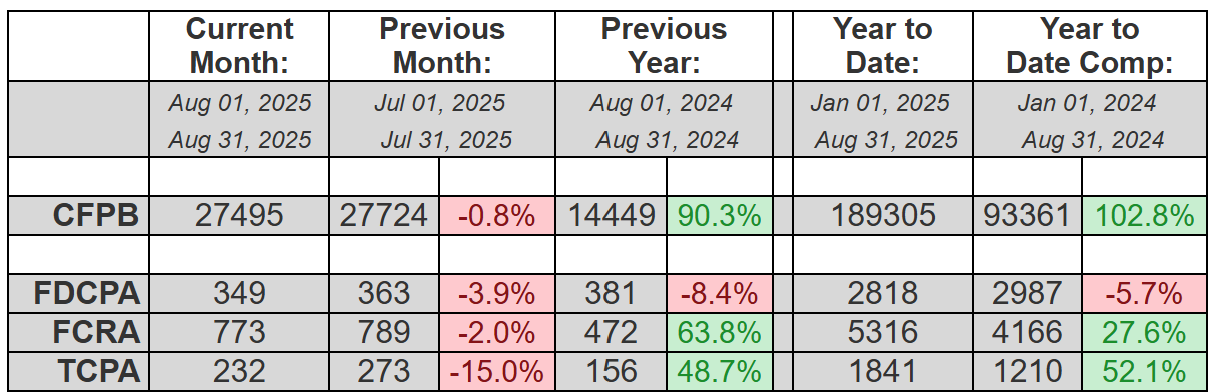
TCPA (-15%) took the biggest hit, followed by FDCPA (-3.9%) and FCRA (-2%), while CFPB complaints dropped a tiny -.8%.
YTD, however, only FDCPA is still down (-5.7%) while TCPA is still up a lot (-52.1%) followed by FCRA (+27.6%). CFPB complaints are still up over 100% from this time last year, 102.8% to be exact.
In other news, putative class actions represented 3.7% of FDCPA, 69.8%(!) of TCPA and 1.3% of FCRA lawsuits filed last month. TCPA class actions are still extraordinarily high, historically speaking. About 41% of all plaintiffs who filed suit last month had filed at least once before. And finally, South Florida attorney Gerald Lane (from The Law Offices of Jibrael S. Hindi) continued for a seventh straight month to represent both the most consumers in August (53) as well as YTD (492).
Complaint Statistics:
27495 consumers filed CFPB complaints, and about 1134 consumers filed lawsuits under consumer statutes from Aug 01, 2025 to Aug 31, 2025.
- 27495 CFPB Complaints
- 349 FDCPA, 13 Class Action (3.7%)
- 232 TCPA, 162 Class Action (69.8%)
- 773 FCRA, 10 Class Action (1.3%)
Litigation Summary (scroll down for CFPB data):
- Of those cases, there were about 1134 unique plaintiffs (including multiple plaintiffs in one suit).
- Of those plaintiffs, about 465, or (41%), had sued under consumer statutes before.
- Combined, those plaintiffs have filed about 4372 lawsuits since 2001
- Actions were filed in 159 different US District Court branches.
- About 788 different collection firms and creditors were sued.
The top courts where lawsuits were filed:
- 94 Lawsuits: Georgia Northern District Court – Atlanta
- 72 Lawsuits: Illinois Northern District Court – Chicago
- 63 Lawsuits: California Central District Court – Western Division – Los Angeles
- 44 Lawsuits: Florida Middle District Court – Tampa
- 37 Lawsuits: Pennsylvania Eastern District Court – Philadelphia
- 32 Lawsuits: California Central District Court – Southern Division – Santa Ana
- 31 Lawsuits: New Jersey District Court – Newark
- 31 Lawsuits: New York Eastern District Court – Brooklyn
- 30 Lawsuits: Texas Southern District Court – Houston
- 27 Lawsuits: Texas Northern District Court – Dallas
The most active consumer attorneys were:
- Representing 53 Consumers: GERALD DONALD LANE
- Representing 31 Consumers: ANTHONY I PARONICH
- Representing 22 Consumers: MARK A CAREY
- Representing 18 Consumers: OCTAVIO GOMEZ
- Representing 16 Consumers: JEFF LOHMAN
- Representing 12 Consumers: YITZCHAK ZELMAN
- Representing 11 Consumers: MATTHEW THOMAS BERRY
- Representing 11 Consumers: ALUKO COLLINS
Statistics Year to Date:
8864 total lawsuits for 2025, including:
- 2818 FDCPA
- 5316 FCRA
- 1841 TCPA
Number of Unique Plaintiffs for 2025: 7560 (including multiple plaintiffs in one suit)
The most active consumer attorneys of the year:
- Representing 492 Consumers: GERALD DONALD LANE
- Representing 200 Consumers: ANTHONY PARONICH
- Representing 192 Consumers: ZANE CHARLES HEDAYA
- Representing 168 Consumers: FAARIS KAMAL UDDIN
- Representing 149 Consumers: OCTAVIO GOMEZ
- Representing 97 Consumers: MARK A CAREY
- Representing 88 Consumers: DAVID J PHILIPPS
- Representing 86 Consumers: TODD M FRIEDMAN
——————————————————————————————————-
CFPB Complaint Statistics:
There were 27495 complaints filed against debt collectors from Aug 01, 2025 to Aug 31, 2025.
Total number of debt collectors complained about: 1065
The types of debt behind the complaints were:
- 14782 I do not know (54%)
- 5078 Other debt (18%)
- 3289 Credit card debt (12%)
- 1472 Auto debt (5%)
- 903 Telecommunications debt (3%)
- 860 Rental debt (3%)
- 628 Medical debt (2%)
- 238 Payday loan debt (1%)
- 97 Federal student loan debt (0%)
- 84 Private student loan debt (0%)
- 64 Mortgage debt (0%)
Here is a breakdown of complaints:
- 11485 Attempts to collect debt not owed (42%)
- 7379 Written notification about debt (27%)
- 3765 Took or threatened to take negative or legal action (14%)
- 3429 False statements or representation (12%)
- 810 Communication tactics (3%)
- 382 Electronic communications (1%)
- 245 Threatened to contact someone or share information improperly (1%)
The top five subissues were:
- 5813 Debt is not yours (21%)
- 4852 Notification didnt disclose it was an attempt to collect a debt (18%)
- 4732 Debt was result of identity theft (17%)
- 3249 Threatened or suggested your credit would be damaged (12%)
- 3244 Attempted to collect wrong amount (12%)
The top states complaints were filed from are:
- 6402 Complaints: TX
- 2678 Complaints: FL
- 2347 Complaints: CA
- 2100 Complaints: GA
- 1169 Complaints: NC
- 1168 Complaints: NY
- 893 Complaints: IL
- 892 Complaints: VA
- 871 Complaints: PA
- 743 Complaints: NJ
The status of the month’s complaints are as follows:
- 12465 In progress (45%)
- 11692 Closed with explanation (43%)
- 2861 Closed with non-monetary relief (10%)
- 454 Untimely response (2%)
- 23 Closed with monetary relief (0%)
This includes 26717 (97%) timely responses to complaints, and 778 (3%) untimely responses.