
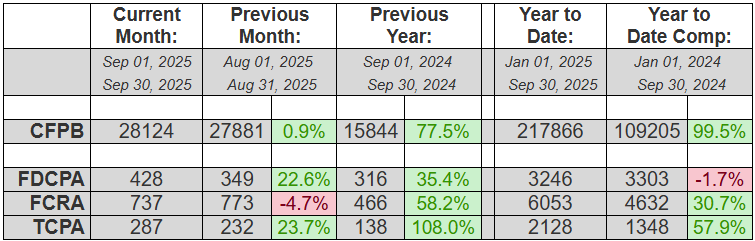
Quick analysis: TCPA, FDCPA way up over last month, FCRA down a bit.
September 2025 saw TCPA and FDCPA litigation spike by double digits (+23.7& and +22.6% respectively) while FCRA litigation ticked down a bit (-4.7%).
Year-to-date, FDCPA is closing the gap and trending to possibly surpass last year’s number. Over the last six months, FDCPA has been hovering in the range of -9% down to -5% down over 2024. In September, that gap dropped to 1.7%. TCPA and FCRA will have no problem significantly surpassing their 2024 totals, with them ahead by +57.9% and +30.7% respectively.
CFPB complaints barely moved last month, with just a +.9% increase over August, but it is still up +99.5% YTD.
In other news, putative class actions represented 5.1% of FDCPA, 78%(!) of TCPA and 1.4% of FCRA lawsuits filed last month. TCPA class actions are still extraordinarily high, historically speaking. About 45% of all plaintiffs who filed suit last month had filed at least once before. And finally, South Florida attorney Gerald Lane (from The Law Offices of Jibrael S. Hindi) continued for an eighth straight month to represent both the most consumers in August (98) as well as YTD (590).
Complaint Statistics:
28124 consumers filed CFPB complaints, and about 1124 consumers filed lawsuits under consumer statutes from Sep 01, 2025 to Sep 30, 2025.
- 28124 CFPB Complaints
- 428 FDCPA, 22 Class Action (5.1%)
- 287 TCPA, 224 Class Action (78.0%)
- 737 FCRA, 10 Class Action (1.4%)
Litigation Summary (scroll down for CFPB data):
- Of those cases, there were about 1124 unique plaintiffs (including multiple plaintiffs in one suit).
- Of those plaintiffs, about 509, or (45%), had sued under consumer statutes before.
- Combined, those plaintiffs have filed about 6014 lawsuits since 2001
- Actions were filed in 149 different US District Court branches.
- About 723 different collection firms and creditors were sued.
The top courts where lawsuits were filed:
- 99 Lawsuits: California Central District Court – Western Division – Los Angeles
- 76 Lawsuits: Georgia Northern District Court – Atlanta
- 58 Lawsuits: Illinois Northern District Court – Chicago
- 48 Lawsuits: California Central District Court – Eastern Division – Riverside
- 40 Lawsuits: Florida Middle District Court – Tampa
- 40 Lawsuits: Florida Southern District Court – Miami
- 31 Lawsuits: Florida Southern District Court – Fort Lauderdale
- 29 Lawsuits: Texas Northern District Court – Dallas
- 28 Lawsuits: New York Eastern District Court – Brooklyn
- 28 Lawsuits: Pennsylvania Eastern District Court – Philadelphia
The most active consumer attorneys were:
- Representing 98 Consumers: GERALD DONALD LANE
- Representing 18 Consumers: VICTOR ZABALETA
- Representing 17 Consumers: GOR ANTONYAN
- Representing 17 Consumers: ZANE CHARLES HEDAYA
- Representing 16 Consumers: OCTAVIO GOMEZ
- Representing 15 Consumers: JONATHAN ALEXANDER HEEPS
- Representing 13 Consumers: AHREN A TILLER
- Representing 12 Consumers: ANTHONY I PARONICH
- Representing 12 Consumers: ESTHER NNEKA OISE
Statistics Year to Date:
10130 total lawsuits for 2025, including:
- 3246 FDCPA
- 6053 FCRA
- 2128 TCPA
Number of Unique Plaintiffs for 2025: 8515 (including multiple plaintiffs in one suit)
The most active consumer attorneys of the year:
- Representing 590 Consumers: GERALD DONALD LANE
- Representing 209 Consumers: ZANE CHARLES HEDAYA
- Representing 176 Consumers: FAARIS KAMAL UDDIN
- Representing 165 Consumers: OCTAVIO GOMEZ
- Representing 215 Consumers: ANTHONY PARONICH
- Representing 99 Consumers: JONATHAN ALEXANDER HEEPS
- Representing 99 Consumers: DAVID J PHILIPPS
- Representing 99 Consumers: MARK A CAREY
——————————————————————————————————-
CFPB Complaint Statistics:
There were 28124 complaints filed against debt collectors from Sep 01, 2025 to Sep 30, 2025.
Total number of debt collectors complained about: 1097
The types of debt behind the complaints were:
- 16157 I do not know (57%)
- 4507 Other debt (16%)
- 3171 Credit card debt (11%)
- 1437 Auto debt (5%)
- 902 Rental debt (3%)
- 806 Telecommunications debt (3%)
- 686 Medical debt (2%)
- 247 Payday loan debt (1%)
- 85 Federal student loan debt (0%)
- 67 Private student loan debt (0%)
- 59 Mortgage debt (0%)
Here is a breakdown of complaints:
- 10436 Attempts to collect debt not owed (37%)
- 7868 Written notification about debt (28%)
- 4711 Took or threatened to take negative or legal action (17%)
- 3776 False statements or representation (13%)
- 771 Communication tactics (3%)
- 358 Electronic communications (1%)
- 204 Threatened to contact someone or share information improperly (1%)
The top five subissues were:
- 5546 Notification didnt disclose it was an attempt to collect a debt (20%)
- 5222 Debt is not yours (19%)
- 4329 Debt was result of identity theft (15%)
- 4161 Threatened or suggested your credit would be damaged (15%)
- 3573 Attempted to collect wrong amount (13%)
The top states complaints were filed from are:
- 6227 Complaints: TX
- 2782 Complaints: CA
- 2710 Complaints: FL
- 2204 Complaints: GA
- 1260 Complaints: NC
- 1053 Complaints: NY
- 1019 Complaints: IL
- 935 Complaints: PA
- 832 Complaints: VA
- 684 Complaints: AZ
The status of the month’s complaints are as follows:
- 13160 In progress (47%)
- 12182 Closed with explanation (43%)
- 2419 Closed with non-monetary relief (9%)
- 334 Untimely response (1%)
- 29 Closed with monetary relief (0%)
This includes 27612 (98%) timely responses to complaints, and 512 (2%) untimely responses.