Litigation Analysis
The Roller Coaster Continues
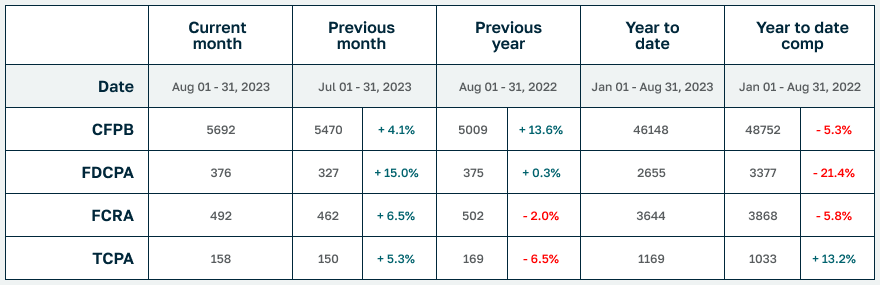
After a down June and a mixed July, lawsuits and complaints were up across the board again in August. FDCPA complaints (+15%) led the pack with FCRA (+6.5%) and TCPA (+5.3%) following. In spite of all the month-over-month increases, only TCPA (+13.2%) remains up YTD, with FDCPA (-21.4%) and FCRA (-5.8%) having some ground to recover if they are going to break even with (or surpass) 2022.
CFPB complaints against creditors and debt collectors were also up for the month (+4.1%) and down for the year (-5.3%).
In other news, putative class actions represented 8.8% of FDCPA, 58.2% of TCPA and 3.5% of FCRA lawsuits filed last month. About 38% of all plaintiffs who filed suit last month had filed at least once before. And finally, Tampa-area attorney Octavio Gomez represented the most consumers in August (23) while Atlanta attorney Matthew Thomas Berry has represented the most consumers YTD (126) so far in 2023.
Complaint Statistics:
5692 consumers filed CFPB complaints, and about 871 consumers filed lawsuits under consumer statutes from Aug 01, 2023 to Aug 31, 2023.
- 5692 CFPB Complaints
- 376 FDCPA, 33 Class Action (8.8%)
- 158 TCPA, 92 Class Action (58.2%)
- 492 FCRA, 17 Class Action (3.5%)
Litigation Summary (scroll down for CFPB data):
- Of those cases, there were about 871 unique plaintiffs (including multiple plaintiffs in one suit).
- Of those plaintiffs, about 329, or (38%), had sued under consumer statutes before.
- Combined, those plaintiffs have filed about 9306 lawsuits since 2001
- Actions were filed in 152 different US District Court branches.
- About 569 different collection firms and creditors were sued.
The top courts where lawsuits were filed:
- 63 Lawsuits: Georgia Northern District Court – Atlanta
- 44 Lawsuits: Illinois Northern District Court – Chicago
- 39 Lawsuits: California Central District Court – Western Division – Los Angeles
- 34 Lawsuits: Florida Middle District Court – Tampa
- 26 Lawsuits: Texas Northern District Court – Dallas
- 24 Lawsuits: Minnesota District Court – Dmn
- 23 Lawsuits: California Central District Court – Southern Division – Santa Ana
- 23 Lawsuits: Indiana Southern District Court – Indianapolis
- 21 Lawsuits: California Southern District Court – San Diego
- 20 Lawsuits: Pennsylvania Eastern District Court – Philadelphia
The most active consumer attorneys were:
- Representing 23 Consumers: OCTAVIO GOMEZ
- Representing 17 Consumers: TODD M FRIEDMAN
- Representing 17 Consumers: JOEL SPENCER HALVORSEN
- Representing 14 Consumers: MATTHEW THOMAS BERRY
- Representing 14 Consumers: DAVID J PHILIPPS
- Representing 13 Consumers: MATTHEW P FORSBERG
- Representing 13 Consumers: JOSEPH POWELL MCCLELLAND
- Representing 13 Consumers: JONATHAN ALEXANDER HEEPS
- Representing 13 Consumers: JOHN THOMAS STEINKAMP
- Representing 11 Consumers: CHRISTOPHER NEIL ARMOR
Statistics Year to Date:
6600 total lawsuits for 2023, including:
- 2655 FDCPA
- 3644 FCRA
- 1169 TCPA
Number of Unique Plaintiffs for 2023: 5897 (including multiple plaintiffs in one suit)
The most active consumer attorneys of the year:
- Representing 126 Consumers: MATTHEW THOMAS BERRY
- Representing 122 Consumers: OCTAVIO GOMEZ
- Representing 97 Consumers: JOSEPH POWELL MCCLELLAND
- Representing 87 Consumers: CHRISTOPHER NEIL ARMOR
- Representing 86 Consumers: DAVID J PHILIPPS
- Representing 82 Consumers: JOEL SPENCER HALVORSEN
- Representing 72 Consumers: NATHAN CHARLES VOLHEIM
- Representing 72 Consumers: ALLEN EDGAR ROBERTSON
- Representing 69 Consumers: AHREN A TILLER
- Representing 68 Consumers: TODD M FRIEDMAN
CFPB Complaint Statistics:
There were 5692 complaints filed against debt collectors from Aug 01, 2023 to Aug 31, 2023.
Total number of debt collectors complained about: 778
The types of debt behind the complaints were:
- 1505 Other debt (26%)
- 1434 I do not know (25%)
- 1430 Credit card debt (25%)
- 572 Medical debt (10%)
- 280 Auto debt (5%)
- 126 Payday loan debt (2%)
- 113 Telecommunications debt (2%)
- 90 Rental debt (2%)
- 68 Mortgage debt (1%)
- 46 Federal student loan debt (1%)
- 28 Private student loan debt (0%)
Here is a breakdown of complaints:
- 3096 Attempts to collect debt not owed (54%)
- 952 Written notification about debt (17%)
- 537 Took or threatened to take negative or legal action (9%)
- 483 False statements or representation (8%)
- 454 Communication tactics (8%)
- 150 Threatened to contact someone or share information improperly (3%)
- 20 Electronic communications (0%)
The top five subissues were:
- 1490 Debt is not yours (26%)
- 1048 Debt was result of identity theft (18%)
- 644 Didnt receive enough information to verify debt (11%)
- 476 Debt was paid (8%)
- 386 Attempted to collect wrong amount (7%)
The top states complaints were filed from are:
- 712 Complaints: TX
- 684 Complaints: FL
- 511 Complaints: CA
- 399 Complaints: GA
- 271 Complaints: NY
- 268 Complaints: IL
- 243 Complaints: PA
- 207 Complaints: NC
- 165 Complaints: OH
- 165 Complaints: MI
The status of the month’s complaints are as follows:
- 4132 Closed with explanation (73%)
- 855 In progress (15%)
- 621 Closed with non-monetary relief (11%)
- 53 Untimely response (1%)
- 31 Closed with monetary relief (1%)
This includes 5580 (98%) timely responses to complaints, and 112 (2%) untimely responses.