Litigation Analysis
Everything Down in August; Most Still Up YTD
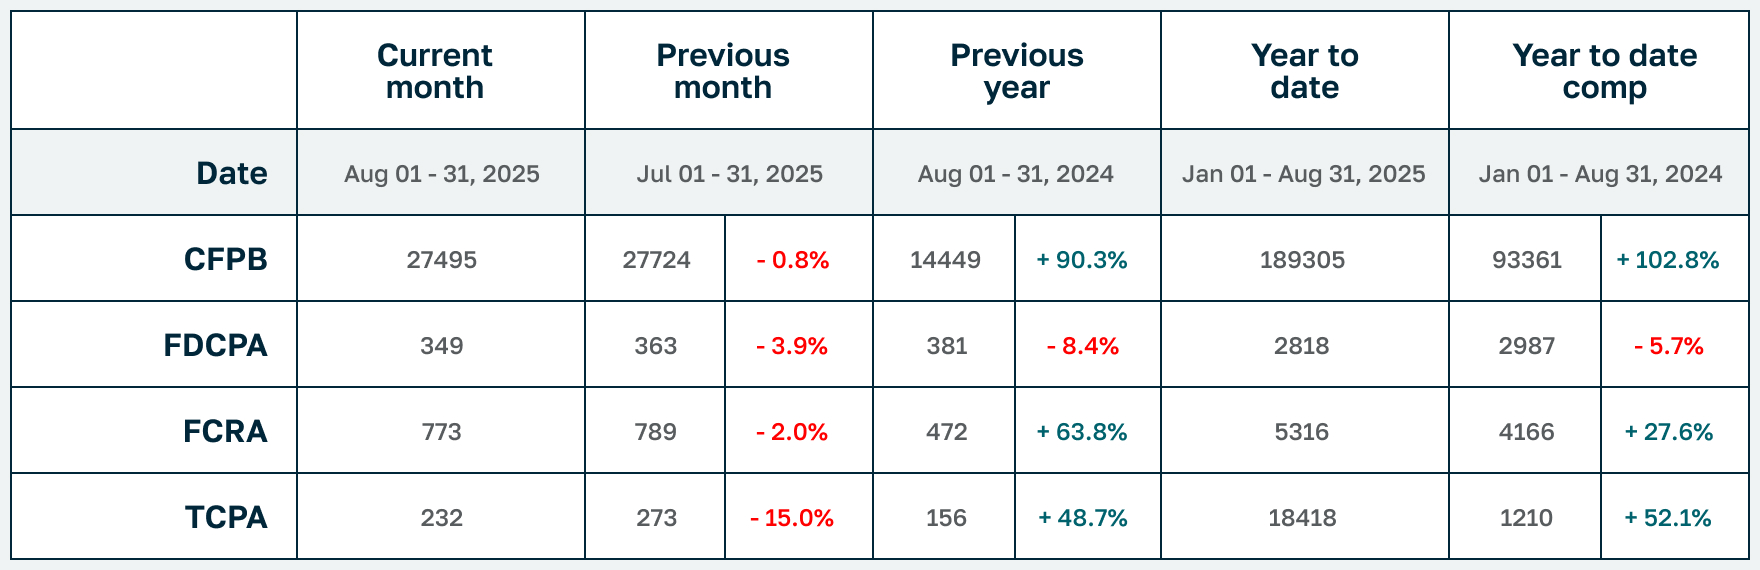
Similar to April of this year, we are seeing a month where everything dipped for the month, but not enough to change the trajectory of the upward year to date trends.
TCPA (-15%) took the biggest hit, followed by FDCPA (-3.9%) and FCRA (-2%), while CFPB complaints dropped a tiny -.8%.
YTD, however, only FDCPA is still down (-5.7%) while TCPA is still up a lot (-52.1%) followed by FCRA (+27.6%). CFPB complaints are still up over 100% from this time last year, 102.8% to be exact.
In other news, putative class actions represented 3.7% of FDCPA, 69.8%(!) of TCPA and 1.3% of FCRA lawsuits filed last month. TCPA class actions are still extraordinarily high, historically speaking. About 41% of all plaintiffs who filed suit last month had filed at least once before. And finally, South Florida attorney Gerald Lane (from The Law Offices of Jibrael S. Hindi) continued for a seventh straight month to represent both the most consumers in August (53) as well as YTD (492).
Complaint statistics
27495 consumers filed CFPB complaints, and about 1134 consumers filed lawsuits under consumer statutes from Aug 01, 2025 to Aug 31, 2025.
- 27495 CFPB Complaints
- 349 FDCPA, 13 Class Action (3.7%)
- 232 TCPA, 162 Class Action (69.8%)
- 773 FCRA, 10 Class Action (1.3%)
Litigation Summary (scroll down for CFPB data):
- Of those cases, there were about 1134 unique plaintiffs (including multiple plaintiffs in one suit).
- Of those plaintiffs, about 465, or (41%), had sued under consumer statutes before.
- Combined, those plaintiffs have filed about 4372 lawsuits since 2001
- Actions were filed in 159 different US District Court branches.
- About 788 different collection firms and creditors were sued.
The top courts where lawsuits were filed:
- 94 Lawsuits: Georgia Northern District Court – Atlanta
- 72 Lawsuits: Illinois Northern District Court – Chicago
- 63 Lawsuits: California Central District Court – Western Division – Los Angeles
- 44 Lawsuits: Florida Middle District Court – Tampa
- 37 Lawsuits: Pennsylvania Eastern District Court – Philadelphia
- 32 Lawsuits: California Central District Court – Southern Division – Santa Ana
- 31 Lawsuits: New Jersey District Court – Newark
- 31 Lawsuits: New York Eastern District Court – Brooklyn
- 30 Lawsuits: Texas Southern District Court – Houston
- 27 Lawsuits: Texas Northern District Court – Dallas
The most active consumer attorneys were:
- Representing 53 Consumers: GERALD DONALD LANE
- Representing 31 Consumers: ANTHONY I PARONICH
- Representing 22 Consumers: MARK A CAREY
- Representing 18 Consumers: OCTAVIO GOMEZ
- Representing 16 Consumers: JEFF LOHMAN
- Representing 12 Consumers: YITZCHAK ZELMAN
- Representing 11 Consumers: MATTHEW THOMAS BERRY
- Representing 11 Consumers: ALUKO COLLINS
Statistics Year to Date:
8864 total lawsuits for 2025, including:
- 2818 FDCPA
- 5316 FCRA
- 1841 TCPA
Number of Unique Plaintiffs for 2025:
7560 (including multiple plaintiffs in one suit)
The most active consumer attorneys of the year:
- Representing 492 Consumers: GERALD DONALD LANE
- Representing 200 Consumers: ANTHONY PARONICH
- Representing 192 Consumers: ZANE CHARLES HEDAYA
- Representing 168 Consumers: FAARIS KAMAL UDDIN
- Representing 149 Consumers: OCTAVIO GOMEZ
- Representing 97 Consumers: MARK A CAREY
- Representing 88 Consumers: DAVID J PHILIPPS
- Representing 86 Consumers: TODD M FRIEDMAN
CFPB Complaint Statistics:
There were 27495 complaints filed against debt collectors from Aug 01, 2025 to Aug 31, 2025.
Total number of debt collectors complained about: 1065
The types of debt behind the complaints were:
- 14782 I do not know (54%)
- 5078 Other debt (18%)
- 3289 Credit card debt (12%)
- 1472 Auto debt (5%)
- 903 Telecommunications debt (3%)
- 860 Rental debt (3%)
- 628 Medical debt (2%)
- 238 Payday loan debt (1%)
- 97 Federal student loan debt (0%)
- 84 Private student loan debt (0%)
- 64 Mortgage debt (0%)
Here is a breakdown of complaints:
- 11485 Attempts to collect debt not owed (42%)
- 7379 Written notification about debt (27%)
- 3765 Took or threatened to take negative or legal action (14%)
- 3429 False statements or representation (12%)
- 810 Communication tactics (3%)
- 382 Electronic communications (1%)
- 245 Threatened to contact someone or share information improperly (1%)
The top five sub issues were:
- 5813 Debt is not yours (21%)
- 4852 Notification didnt disclose it was an attempt to collect a debt (18%)
- 4732 Debt was result of identity theft (17%)
- 3249 Threatened or suggested your credit would be damaged (12%)
- 3244 Attempted to collect wrong amount (12%)
The top states complaints were filed from are:
- 6402 Complaints: TX
- 2678 Complaints: FL
- 2347 Complaints: CA
- 2100 Complaints: GA
- 1169 Complaints: NC
- 1168 Complaints: NY
- 893 Complaints: IL
- 892 Complaints: VA
- 871 Complaints: PA
- 743 Complaints: NJ
The status of the month’s complaints are as follows:
- 12465 In progress (45%)
- 11692 Closed with explanation (43%)
- 2861 Closed with non-monetary relief (10%)
- 454 Untimely response (2%)
- 23 Closed with monetary relief (0%)
This includes 26717 (97%) timely responses to complaints, and 778 (3%) untimely responses.