Mixed August Shows One Solid Trend
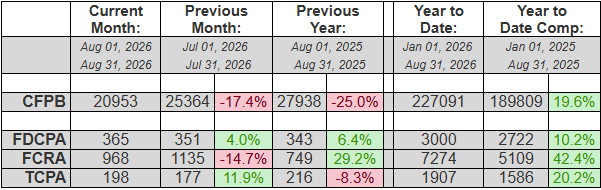
While the month of August had ups (FDCPA +4.0%, TCPA +11.9%) and downs (FCRA -14.7%, CFPB complaints -17.4%), one trend for 2026 is becoming clear - everything is increasing in 2026 over 2025's numbers. YTD numbers show this in detail: TCPA (+20.2%), FCRA (+42.4%), FDCPA (+10.2%) and CFPB complaints (+19.6%).
Assuming this holds over the next few months, it will represent the second year in a row of substantive increases in FDCPA litigation after a solid decade of decreasing numbers.
In other news, putative class actions represented 9.3% of FDCPA, 72.2% of TCPA and 1.1% of FCRA lawsuits filed last month. About 36% of all plaintiffs who filed suit last month had filed at least once before. And finally, Dallas attorney Jonathan Heeps has broken South Florida attorney Gerald Lane's epic run of eighteenth consecutive months representing the most consumers. Heeps represented 46 consumers in August (above Lane's 42), while Lane still holds the title for representing 483 consumers YTD (above Heep's 208).
Complaint Statistics:
20953 consumers filed CFPB complaints, and about 1299 consumers filed lawsuits under consumer statutes from Aug 01, 2026 to Aug 31, 2026.
- 20953 CFPB Complaints
- 365 FDCPA, 34 Class Action (9.3%)
- 198 TCPA, 143 Class Action (72.2%)
- 968 FCRA, 11 Class Action (1.1%)
Litigation Summary (scroll down for CFPB data):
- Of those cases, there were about 1299 unique plaintiffs (including multiple plaintiffs in one suit).
- Of those plaintiffs, about 472, or (36%), had sued under consumer statutes before.
- Combined, those plaintiffs have filed about 7836 lawsuits since 2001
- Actions were filed in 159 different US District Court branches.
- About 669 different collection firms and creditors were sued.
The top courts where lawsuits were filed:
- 117 Lawsuits: Georgia Northern District Court - Atlanta
- 113 Lawsuits: District Court For The Northern District Of Illinois
- 84 Lawsuits: California Central District Court - Western Division - Los Angeles
- 67 Lawsuits: California Central District Court - Southern Division - Santa Ana
- 52 Lawsuits: Florida Middle District Court - Tampa
- 43 Lawsuits: Michigan Eastern District Court - Detroit
- 42 Lawsuits: Texas Southern District Court - Houston
- 40 Lawsuits: Texas Western District Court - Austin
- 38 Lawsuits: California Southern District Court - San Diego
- 37 Lawsuits: Texas Eastern District Court - Sherman
The most active consumer attorneys were:
- Representing 46 Consumers: JONATHAN ALEXANDER HEEPS
- Representing 42 Consumers: GERALD DONALD LANE
- Representing 40 Consumers: KYLE W SCHUMACHER
- Representing 31 Consumers: JOSHUA BRYAN LANE
- Representing 29 Consumers: VINIT ROY VENKATESH
- Representing 29 Consumers: BLAKE R BAUER
- Representing 28 Consumers: LANDON T MAXWELL
- Representing 27 Consumers: ESTHER NNEKA OISE
- Representing 26 Consumers: SCOTT EDWIN FERRELL
- Representing 25 Consumers: HEATHER RENEE HICKS
Statistics Year to Date:
10969 total lawsuits for 2026, including:
- 3000 FDCPA
- 7274 FCRA
- 1907 TCPA
Number of Unique Plaintiffs for 2026: 9419 (including multiple plaintiffs in one suit)
The most active consumer attorneys of the year:
- Representing 483 Consumers: GERALD DONALD LANE
- Representing 208 Consumers: JONATHAN ALEXANDER HEEPS
- Representing 185 Consumers: ESTHER NNEKA OISE
- Representing 171 Consumers: KYLE W SCHUMACHER
- Representing 144 Consumers: MARK A CAREY
- Representing 138 Consumers: JEFF LOHMAN
- Representing 116 Consumers: JOEL S HALVORSEN
- Representing 114 Consumers: BLAKE R BAUER
- Representing 112 Consumers: SEID MUSIC
——————————————————————————————————-
CFPB Complaint Statistics:
There were 20953 complaints filed against debt collectors from Aug 01, 2026 to Aug 31, 2026.
Total number of debt collectors complained about: 1166
The types of debt behind the complaints were:
- 12962 I do not know (62%)
- 2715 Credit card debt (13%)
- 2259 Other debt (11%)
- 907 Telecommunications debt (4%)
- 835 Rental debt (4%)
- 572 Medical debt (3%)
- 377 Auto debt (2%)
- 203 Payday loan debt (1%)
- 46 Private student loan debt (0%)
- 42 Mortgage debt (0%)
- 35 Federal student loan debt (0%)
Here is a breakdown of complaints:
- 10723 Attempts to collect debt not owed (51%)
- 3692 Written notification about debt (18%)
- 3207 Took or threatened to take negative or legal action (15%)
- 2111 False statements or representation (10%)
- 640 Communication tactics (3%)
- 360 Electronic communications (2%)
- 220 Threatened to contact someone or share information improperly (1%)
The top five subissues were:
- 7980 Debt is not yours (38%)
- 2846 Threatened or suggested your credit would be damaged (14%)
- 1997 Attempted to collect wrong amount (10%)
- 1979 Debt was result of identity theft (9%)
- 1630 Didnt receive enough information to verify debt (8%)
The top states complaints were filed from are:
- 3492 Complaints: TX
- 2271 Complaints: FL
- 1644 Complaints: CA
- 1602 Complaints: GA
- 870 Complaints: NC
- 841 Complaints: NY
- 736 Complaints: SC
- 726 Complaints: MS
- 666 Complaints: PA
- 662 Complaints: IL
The status of the month’s complaints are as follows:
- 11083 Closed with explanation (53%)
- 5357 In progress (26%)
- 4025 Closed with non-monetary relief (19%)
- 466 Untimely response (2%)
- 22 Closed with monetary relief (0%)
This includes 20360 (97%) timely responses to complaints, and 593 (3%) untimely responses.