Litigation Analysis
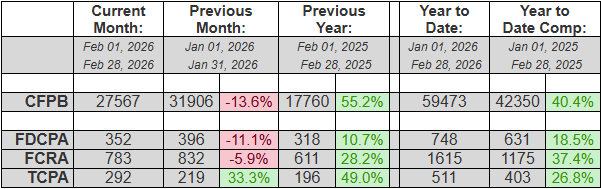
Quick analysis: TCPA Way Up, Everything Else Down for Feb
In February, TCPA (+33.3%) was the only consumer statute to increase its filings over January, while FDCPA (-11.1%) and FCRA (-5.9%) were both down. CFPB complaints (-13.6) were also down.In spite of that, due to the strong launch of consumer filings in January, everything is still up YTD - with TCPA (+26.8%), FDCPA (+18.5%) and FCRA (+37.4%) all showing strong resilience so far in 2026. Even CFPB complaints, in spite of a weak February, are still up +40.4% over this time last year.
In other news, putative class actions represented 2.3% of FDCPA, 72.3% of TCPA and 1.9% of FCRA lawsuits filed last month. TCPA class actions are still extraordinarily high, historically speaking. About 42% of all plaintiffs who filed suit last month had filed at least once before. And finally, South Florida attorney Gerald Lane (from The Law Offices of Jibrael S. Hindi) continued for a 13th straight month to represent both the most consumers in January (93) as well as YTD (152).
Complaint Statistics:
27567 consumers filed CFPB complaints, and about 1161 consumers filed lawsuits under consumer statutes from Feb 01, 2026 to Feb 28, 2026.
- 27567 CFPB Complaints
- 352 FDCPA, 8 Class Action (2.3%)
- 292 TCPA, 211 Class Action (72.3%)
- 783 FCRA, 15 Class Action (1.9%)
Litigation Summary (scroll down for CFPB data):
- Of those cases, there were about 1161 unique plaintiffs (including multiple plaintiffs in one suit).
- Of those plaintiffs, about 490, or (42%), had sued under consumer statutes before.
- Combined, those plaintiffs have filed about 6956 lawsuits since 2001
- Actions were filed in 150 different US District Court branches.
- About 784 different collection firms and creditors were sued.
The top courts where lawsuits were filed:
- 125 Lawsuits: Georgia Northern District Court - Atlanta
- 92 Lawsuits: California Central District Court - Western Division - Los Angeles
- 72 Lawsuits: Illinois Northern District Court - Chicago
- 46 Lawsuits: Florida Middle District Court - Tampa
- 37 Lawsuits: California Southern District Court - San Diego
- 33 Lawsuits: California Central District Court - Southern Division - Santa Ana
- 30 Lawsuits: Texas Northern District Court - Dallas
- 29 Lawsuits: Florida Southern District Court - Fort Lauderdale
- 29 Lawsuits: Texas Southern District Court - Houston
- 28 Lawsuits: Pennsylvania Eastern District Court - Philadelphia
The most active consumer attorneys were:
- Representing 93 Consumers: GERALD DONALD LANE
- Representing 37 Consumers: MARK A CAREY
- Representing 18 Consumers: JONATHAN ALEXANDER HEEPS
- Representing 17 Consumers: JEFF LOHMAN
- Representing 17 Consumers: ANTHONY I PARONICH
- Representing 16 Consumers: ESTHER NNEKA OISE
- Representing 15 Consumers: SEID MUSIC
- Representing 15 Consumers: DAVID J PHILIPPS
- Representing 14 Consumers: AHREN A TILLER
Statistics Year to Date:
2544 total lawsuits for 2026, including:
- 748 FDCPA
- 1615 FCRA
- 511 TCPA
Number of Unique Plaintiffs for 2026: 2338 (including multiple plaintiffs in one suit)
The most active consumer attorneys of the year:
- Representing 152 Consumers: GERALD DONALD LANE
- Representing 80 Consumers: MARK A CAREY
- Representing 34 Consumers: ZANE CHARLES HEDAYA
- Representing 33 Consumers: JONATHAN ALEXANDER HEEPS
- Representing 32 Consumers: JEFF LOHMAN
- Representing 30 Consumers: OCTAVIO GOMEZ
- Representing 28 Consumers: ESTHER NNEKA OISE
- Representing 27 Consumers: SEID MUSIC
- Representing 24 Consumers: ANTHONY I PARONICH
——————————————————————————————————-
CFPB Complaint Statistics:
There were 27567 complaints filed against debt collectors from Feb 01, 2026 to Feb 28, 2026.
Total number of debt collectors complained about: 1117
The types of debt behind the complaints were:
- 17800 I do not know (65%)
- 3271 Other debt (12%)
- 2981 Credit card debt (11%)
- 1084 Telecommunications debt (4%)
- 899 Rental debt (3%)
- 636 Medical debt (2%)
- 456 Auto debt (2%)
- 254 Payday loan debt (1%)
- 78 Federal student loan debt (0%)
- 58 Private student loan debt (0%)
- 50 Mortgage debt (0%)
Here is a breakdown of complaints:
- 12191 Attempts to collect debt not owed (44%)
- 7125 Took or threatened to take negative or legal action (26%)
- 3945 Written notification about debt (14%)
- 3014 False statements or representation (11%)
- 695 Communication tactics (3%)
- 416 Electronic communications (2%)
- 181 Threatened to contact someone or share information improperly (1%)
The top five subissues were:
- 6996 Debt is not yours (25%)
- 6718 Threatened or suggested your credit would be damaged (24%)
- 4289 Debt was result of identity theft (16%)
- 2848 Attempted to collect wrong amount (10%)
- 2609 Didnt receive enough information to verify debt (9%)
The top states complaints were filed from are:
- 4510 Complaints: TX
- 3229 Complaints: FL
- 2514 Complaints: CA
- 2502 Complaints: GA
- 1211 Complaints: SC
- 1085 Complaints: NC
- 1000 Complaints: NY
- 947 Complaints: PA
- 903 Complaints: IL
- 690 Complaints: NJ
The status of the month’s complaints are as follows:
- 18757 Closed with explanation (68%)
- 4466 In progress (16%)
- 3668 Closed with non-monetary relief (13%)
- 652 Untimely response (2%)
- 24 Closed with monetary relief (0%)
This includes 26730 (97%) timely responses to complaints, and 837 (3%) untimely responses.