Litigation Analysis
2024 Starts with a ROAR
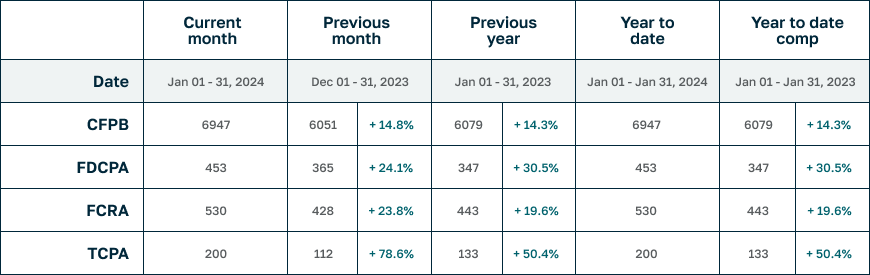
We can’t remember the last time consumer complaints and litigation had such a strong month across the board. Everything in January was up double digit percentages over Dec 2023: TCPA +78.6%(!), FDCPA +24.1%, FCRA +23.8%. And everything was also up double digit percentages YTD against last year: TCPA +50.4%, FDCPA +30.5%, FCRA +19.6%. CFPB complaints were similarly up +14.8% for the month and +14.3% YTD.
For some context, here’s a thought experiment. If every month in 2024 ends up like January, TCPA litigation would end the year 42.6% up over 2023, FDCPA would be 30.5% up and FCRA would be 13.8% higher. That’s a pattern we haven’t seen in many years, but of course these numbers are only one month in to 2024 and don’t really mean anything yet. Other than, wow, what a month.
In other news, putative class actions represented 5.3% of FDCPA, 32% of TCPA and 2.6% of FCRA lawsuits filed last month. About 48%(!) of all plaintiffs who filed suit last month had filed at least once before. And finally, Dallas-area attorney Chris R. Miltenberger gets his first crack at the top spot for representing the most consumers in January (as well as YTD) with 54 consumers represented.
Complaint Statistics:
6947 consumers filed CFPB complaints, and about 976 consumers filed lawsuits under consumer statutes from Jan 01, 2024 to Jan 31, 2024.
- 6947 CFPB Complaints
- 453 FDCPA, 24 Class Action (5.3%)
- 200 TCPA, 64 Class Action (32.0%)
- 530 FCRA, 14 Class Action (2.6%)
Litigation Summary (scroll down for CFPB data):
- Of those cases, there were about 976 unique plaintiffs (including multiple plaintiffs in one suit).
- Of those plaintiffs, about 468, or (48%), had sued under consumer statutes before.
- Combined, those plaintiffs have filed about 7202 lawsuits since 2001
- Actions were filed in 155 different US District Court branches.
- About 681 different collection firms and creditors were sued.
The top courts where lawsuits were filed:
- 56 Lawsuits: Florida Middle District Court – Tampa
- 56 Lawsuits: Georgia Northern District Court – Atlanta
- 36 Lawsuits: Illinois Northern District Court – Chicago
- 31 Lawsuits: Texas Northern District Court – Dallas
- 30 Lawsuits: California Central District Court – Western Division – Los Angeles
- 29 Lawsuits: Indiana Southern District Court – Indianapolis
- 28 Lawsuits: Florida Middle District Court – Orlando
- 27 Lawsuits: California Southern District Court – San Diego
- 23 Lawsuits: Texas Southern District Court – Houston
- 22 Lawsuits: Florida Southern District Court – Fort Lauderdale
The most active consumer attorneys were:
- Representing 54 Consumers: CHRIS R MILTENBERGER
- Representing 24 Consumers: OCTAVIO GOMEZ
- Representing 18 Consumers: DAVID J PHILIPPS
- Representing 17 Consumers: MATTHEW THOMAS BERRY
- Representing 17 Consumers: SHAWN SHAWN JAFFER
- Representing 15 Consumers: JONATHAN ALEXANDER HEEPS
- Representing 14 Consumers: CHRISTOPHER NEIL ARMOR
- Representing 13 Consumers: FRANK H KERNEY
- Representing 12 Consumers: ELLIOT ELO
- Representing 12 Consumers: JENNIFER GOMES SIMIL
Statistics Year to Date:
960 total lawsuits for 2024, including:
- 453 FDCPA
- 530 FCRA
- 200 TCPA
Number of Unique Plaintiffs for 2024: 976 (including multiple plaintiffs in one suit)
The most active consumer attorneys of the year:
- Representing 54 Consumers: CHRIS R MILTENBERGER
- Representing 24 Consumers: OCTAVIO GOMEZ
- Representing 18 Consumers: DAVID J PHILIPPS
- Representing 17 Consumers: MATTHEW THOMAS BERRY
- Representing 17 Consumers: SHAWN SHAWN JAFFER
- Representing 15 Consumers: JONATHAN ALEXANDER HEEPS
- Representing 14 Consumers: CHRISTOPHER NEIL ARMOR
- Representing 13 Consumers: FRANK H KERNEY
- Representing 12 Consumers: ELLIOT ELO
- Representing 12 Consumers: JENNIFER GOMES SIMIL
CFPB Complaint Statistics:
There were 6947 complaints filed against debt collectors from Jan 01, 2024 to Jan 31, 2024.
Total number of debt collectors complained about: 778
The types of debt behind the complaints were:
- 1901 I do not know (27%)
- 1759 Credit card debt (25%)
- 1203 Other debt (17%)
- 522 Medical debt (8%)
- 470 Rental debt (7%)
- 437 Telecommunications debt (6%)
- 356 Auto debt (5%)
- 140 Payday loan debt (2%)
- 64 Mortgage debt (1%)
- 59 Federal student loan debt (1%)
- 36 Private student loan debt (1%)
Here is a breakdown of complaints:
- 3599 Attempts to collect debt not owed (52%)
- 1699 Written notification about debt (24%)
- 570 Took or threatened to take negative or legal action (8%)
- 463 False statements or representation (7%)
- 389 Communication tactics (6%)
- 120 Electronic communications (2%)
- 107 Threatened to contact someone or share information improperly (2%)
The top five subissues were:
- 1602 Debt is not yours (23%)
- 1413 Debt was result of identity theft (20%)
- 1388 Didnt receive enough information to verify debt (20%)
- 474 Debt was paid (7%)
- 371 Attempted to collect wrong amount (5%)
The top states complaints were filed from are:
- 917 Complaints: CA
- 903 Complaints: TX
- 644 Complaints: FL
- 482 Complaints: NY
- 445 Complaints: GA
- 358 Complaints: IL
- 300 Complaints: PA
- 215 Complaints: NJ
- 191 Complaints: LA
- 182 Complaints: OH
The status of the month’s complaints are as follows:
- 4263 Closed with explanation (61%)
- 1661 In progress (24%)
- 916 Closed with non-monetary relief (13%)
- 86 Untimely response (1%)
- 21 Closed with monetary relief (0%)
This includes 6810 (98%) timely responses to complaints, and 137 (2%) untimely responses.