Litigation Analysis
Quick analysis: 2026 Kicks off with mixed results
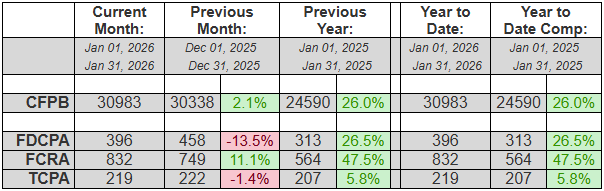
January 2026 numbers are in, and it shows TCPA (-1.4%) and FDCPA (-13.5%) numbers down from the previous month, while FCRA (+11.1%) litigation was up, along with CFPB complaints (+2.1%). All four categories are up significantly from Jan 2025 however. Year-over-year, TCPA (+5.8%), FDCPA (+26.5%), FCRA (+47.5%) and CFPB complaints (+26%) all started with a bang this year.
In other news, putative class actions represented 10.4% of FDCPA, 77.6% of TCPA and 1.7% of FCRA lawsuits filed last month. TCPA class actions are still extraordinarily high, historically speaking. About 41% of all plaintiffs who filed suit last month had filed at least once before. And finally, South Florida attorney Gerald Lane (from The Law Offices of Jibrael S. Hindi) continued for a twelfth straight month to represent both the most consumers in January (59) as well as YTD (59).
Complaint Statistics:
30983 consumers filed CFPB complaints, and about 1233 consumers filed lawsuits under consumer statutes from Jan 01, 2026 to Jan 31, 2026.
- 30983 CFPB Complaints
- 396 FDCPA, 41 Class Action (10.4%)
- 219 TCPA, 170 Class Action (77.6%)
- 832 FCRA, 14 Class Action (1.7%)
Litigation Summary (scroll down for CFPB data):
- Of those cases, there were about 1233 unique plaintiffs (including multiple plaintiffs in one suit).
- Of those plaintiffs, about 506, or (41%), had sued under consumer statutes before.
- Combined, those plaintiffs have filed about 7850 lawsuits since 2001
- Actions were filed in 150 different US District Court branches.
- About 666 different collection firms and creditors were sued.
The top courts where lawsuits were filed:
- 126 Lawsuits: Georgia Northern District Court - Atlanta
- 92 Lawsuits: Illinois Northern District Court - Chicago
- 63 Lawsuits: California Central District Court - Western Division - Los Angeles
- 42 Lawsuits: Florida Middle District Court - Tampa
- 41 Lawsuits: Florida Middle District Court - Orlando
- 38 Lawsuits: Florida Southern District Court - Miami
- 36 Lawsuits: New Jersey District Court - Newark
- 33 Lawsuits: New York Eastern District Court - Brooklyn
- 33 Lawsuits: Texas Southern District Court - Houston
- 29 Lawsuits: California Central District Court - Eastern Division - Riverside
The most active consumer attorneys were:
- Representing 59 Consumers: GERALD DONALD LANE
- Representing 43 Consumers: MARK A CAREY
- Representing 20 Consumers: ZANE CHARLES HEDAYA
- Representing 20 Consumers: GERARDO AVALOS
- Representing 20 Consumers: GEORGE HAINES
- Representing 18 Consumers: DANIEL JAMES VEDRA
- Representing 16 Consumers: OCTAVIO GOMEZ
- Representing 15 Consumers: JONATHAN ALEXANDER HEEPS
- Representing 15 Consumers: YITZCHAK ZELMAN
Statistics Year to Date:
1294 total lawsuits for 2026, including:
- 396 FDCPA
- 832 FCRA
- 219 TCPA
Number of Unique Plaintiffs for 2026: 1233 (including multiple plaintiffs in one suit)
The most active consumer attorneys of the year:
- Representing 59 Consumers: GERALD DONALD LANE
- Representing 43 Consumers: MARK A CAREY
- Representing 20 Consumers: ZANE CHARLES HEDAYA
- Representing 20 Consumers: GERARDO AVALOS
- Representing 20 Consumers: GEORGE HAINES
- Representing 18 Consumers: DANIEL JAMES VEDRA
- Representing 16 Consumers: OCTAVIO GOMEZ
- Representing 15 Consumers: JONATHAN ALEXANDER HEEPS
- Representing 15 Consumers: YITZCHAK ZELMAN
——————————————————————————————————-
CFPB Complaint Statistics:
There were 30983 complaints filed against debt collectors from Jan 01, 2026 to Jan 31, 2026.
Total number of debt collectors complained about: 1185
The types of debt behind the complaints were:
- 19172 I do not know (62%)
- 4710 Other debt (15%)
- 3173 Credit card debt (10%)
- 1085 Rental debt (4%)
- 1042 Telecommunications debt (3%)
- 742 Medical debt (2%)
- 573 Auto debt (2%)
- 301 Payday loan debt (1%)
- 86 Private student loan debt (0%)
- 54 Federal student loan debt (0%)
- 45 Mortgage debt (0%)
Here is a breakdown of complaints:
- 12143 Attempts to collect debt not owed (39%)
- 8089 Took or threatened to take negative or legal action (26%)
- 5893 Written notification about debt (19%)
- 3273 False statements or representation (11%)
- 878 Communication tactics (3%)
- 443 Electronic communications (1%)
- 264 Threatened to contact someone or share information improperly (1%)
The top five subissues were:
- 7574 Threatened or suggested your credit would be damaged (24%)
- 6645 Debt is not yours (21%)
- 4545 Debt was result of identity theft (15%)
- 3492 Didnt receive enough information to verify debt (11%)
- 3102 Attempted to collect wrong amount (10%)
The top states complaints were filed from are:
- 5426 Complaints: TX
- 3274 Complaints: FL
- 2843 Complaints: GA
- 2836 Complaints: CA
- 1426 Complaints: SC
- 1209 Complaints: NY
- 1195 Complaints: NC
- 1072 Complaints: PA
- 1010 Complaints: IL
- 825 Complaints: AL
The status of the month’s complaints are as follows:
- 20095 Closed with explanation (65%)
- 5617 In progress (18%)
- 4681 Closed with non-monetary relief (15%)
- 567 Untimely response (2%)
- 23 Closed with monetary relief (0%)
This includes 30100 (97%) timely responses to complaints, and 883 (3%) untimely responses.