Litigation Analysis
From a slog to a slump.
Last month we talked about the “June Litigation Slog” – and now we are extending it to the “Dog Days Slump”.
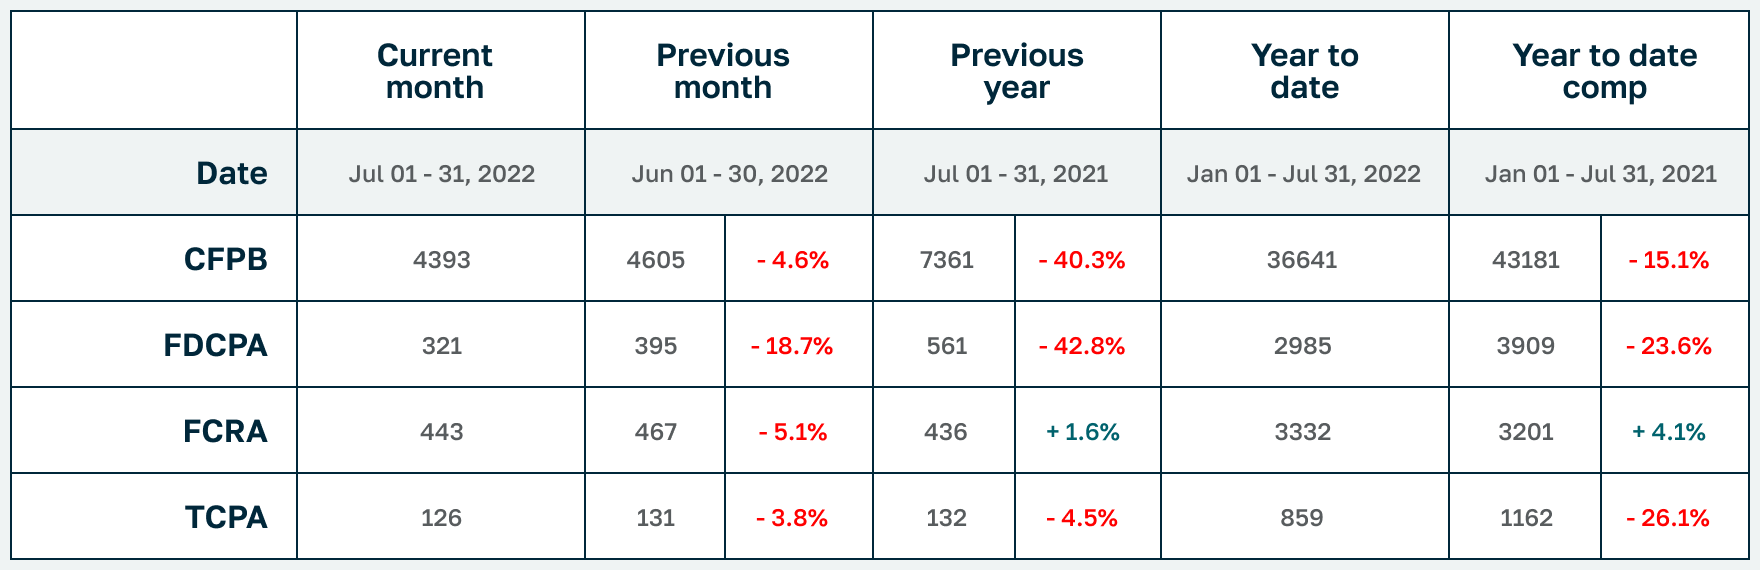
Consumer litigation is down across the board again from last month (TCPA -3.8%, FDCPA -18.7%, FCRA -5.1%), and YTD too (TCPA -26.1%, FDCPA -23.6%) with the exception of FCRA filings – which only ticked up a meager +1.6%.
CFPB complaints also declined -4.6% for the month and are down -15.1% YTD – it seems like that decline is getting steeper as the year goes on.
In other news, putative class actions represented 11.5% of FDCPA, 65.1% of TCPA and 1.4% of FCRA lawsuits filed last month. About 41% of all plaintiffs who filed suit last month had filed at least once before. And finally, Nevada attorneys Shawn Wayne Miller and David H Krieger took the top spot for representing the most consumers in July (22) while Florida attorney Jibrael S Hindi has still represented the most consumers for the year so far (214).
Complaint Statistics:
4393 consumers filed CFPB complaints, and about 781 consumers filed lawsuits under consumer statutes from Jul 01, 2022 to Jul 31, 2022.
- 4393 CFPB Complaints
- 321 FDCPA, 37 Class Action (11.5%)
- 126 TCPA, 82 Class Action (65.1%)
- 443 FCRA, 6 Class Action (1.4%)
Litigation Summary (scroll down for CFPB data):
- Of those cases, there were about 781 unique plaintiffs (including multiple plaintiffs in one suit).
- Of those plaintiffs, about 322, or (41%), had sued under consumer statutes before.
- Combined, those plaintiffs have filed about 2023 lawsuits since 2001
- Actions were filed in 131 different US District Court branches.
- About 528 different collection firms and creditors were sued.
The top courts where lawsuits were filed:
- 38 Lawsuits: Illinois Northern District Court – Chicago
- 37 Lawsuits: Georgia Northern District Court – Atlanta
- 35 Lawsuits: Florida Middle District Court – Tampa
- 31 Lawsuits: Pennsylvania Eastern District Court – Philadelphia
- 28 Lawsuits: California Central District Court – Western Division – Los Angeles
- 26 Lawsuits: Nevada District Court – Las Vegas
- 25 Lawsuits: Minnesota District Court – Dmn
- 24 Lawsuits: Florida Southern District Court – Miami
- 19 Lawsuits: New Jersey District Court – Newark
- 17 Lawsuits: Florida Middle District Court – Orlando
The most active consumer attorneys were:
- Representing 22 Consumers: DAVID H KRIEGER
- Representing 22 Consumers: SHAWN WAYNE MILLER
- Representing 16 Consumers: MICHAEL FREDERICK CARDOZA
- Representing 16 Consumers: CATRINA EOM SMITH
- Representing 14 Consumers: ANDREW JOHN SHAMIS
- Representing 13 Consumers: SCOTT ADAM EDELSBERG
- Representing 11 Consumers: GARRETT O BERG
- Representing 11 Consumers: JENNIFER GOMES SIMIL
- Representing 11 Consumers: DAVID J PHILIPPS
- Representing 9 Consumers: NICOLA CARLENE RICHARDS
Statistics Year to Date:
6590 total lawsuits for 2022, including:
- 2985 FDCPA
- 3332 FCRA
- 859 TCPA
Number of Unique Plaintiffs for 2022: 5982 (including multiple plaintiffs in one suit)
The most active consumer attorneys of the year:
- Representing 214 Consumers: JIBRAEL JARALLAH SAID HINDI
- Representing 192 Consumers: THOMAS JOHN PATTI
- Representing 153 Consumers: MATTHEW THOMAS BERRY
- Representing 129 Consumers: CRAIG CARLEY MARCHIANDO
- Representing 122 Consumers: LEONARD ANTHONY BENNETT
- Representing 113 Consumers: DREW DAVID SARRETT
- Representing 100 Consumers: MICHAEL FREDERICK CARDOZA
- Representing 90 Consumers: CHRISTOPHER NEIL ARMOR
- Representing 83 Consumers: SYED HASEEB HUSSAIN
CFPB Complaint Statistics:
There were 4393 complaints filed against debt collectors from Jul 01, 2022 to Jul 31, 2022.
Total number of debt collectors complained about: 734
The types of debt behind the complaints were:
- 1305 Other debt (30%)
- 1010 Credit card debt (23%)
- 980 I do not know (22%)
- 648 Medical debt (15%)
- 209 Auto debt (5%)
- 112 Payday loan debt (3%)
- 68 Mortgage debt (2%)
- 46 Private student loan debt (1%)
- 15 Federal student loan debt (0%)
Here is a breakdown of complaints:
- 2272 Attempts to collect debt not owed (52%)
- 972 Written notification about debt (22%)
- 401 Took or threatened to take negative or legal action (9%)
- 350 Communication tactics (8%)
- 327 False statements or representation (7%)
- 71 Threatened to contact someone or share information improperly (2%)
The top five subissues were:
- 1085 Debt is not yours (25%)
- 723 Debt was result of identity theft (16%)
- 587 Didnt receive enough information to verify debt (13%)
- 387 Debt was paid (9%)
- 349 Didnt receive notice of right to dispute (8%)
The top states complaints were filed from are:
- 537 Complaints: FL
- 516 Complaints: TX
- 408 Complaints: CA
- 365 Complaints: GA
- 191 Complaints: IL
- 188 Complaints: NY
- 179 Complaints: PA
- 152 Complaints: NC
- 139 Complaints: VA
- 138 Complaints: MD
The status of the month’s complaints are as follows:
- 3316 Closed with explanation (75%)
- 596 In progress (14%)
- 399 Closed with non-monetary relief (9%)
- 51 Untimely response (1%)
- 31 Closed with monetary relief (1%)
This includes 4250 (97%) timely responses to complaints, and 143 (3%) untimely responses.