Litigation Analysis
Mixed Results
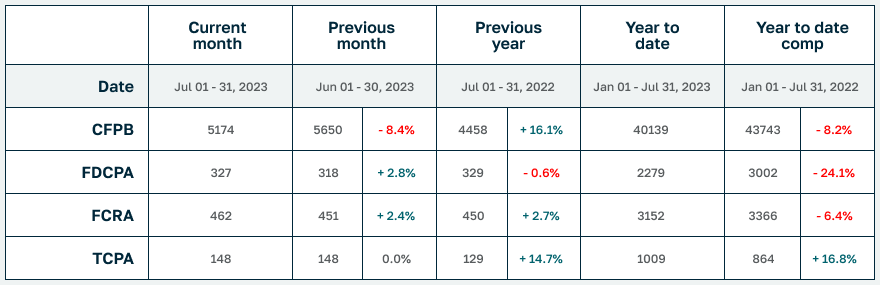
Well, it was bound to happen. Statistically speaking, anyway. For the first time I can remember in nearly 15 years of tracking these numbers, we had a 0.0% month-over-month change in one of the statutes (TCPA). Relevant? No. Meaningful? Also no. But interesting to me nonetheless, and since I write these things, it gets top billing.
After an all- down month in June, July’s numbers were decidedly more mixed. FDCPA (+2.8%) and FCRA (+2.4%) were up slightly while TCPA (0.0%) had no change whatsover. Year-to-date, the script was flipped with FDCPA (-24.1%) and FCRA (-6.4%) both down while TCPA (+16.8) is up.
CFPB complaints against collectors and creditors were down again both for the month (-8.4%) and for the year (-8.2%).
In other news, putative class actions represented 7.3% of FDCPA, 66.2% of TCPA (!) and 2.2% of FCRA lawsuits filed last month. About 41% of all plaintiffs who filed suit last month had filed at least once before. And finally, Tampa-area attorney Octavio Gomez represented the most consumers in July (23) while Atlanta attorney Matthew Thomas Berry has represented the most consumers YTD (112) so far in 2023.
Complaint Statistics:
5174 consumers filed CFPB complaints, and about 791 consumers filed lawsuits under consumer statutes from Jul 01, 2023 to Jul 31, 2023.
- 5174 CFPB Complaints
- 327 FDCPA, 24 Class Action (7.3%)
- 148 TCPA, 98 Class Action (66.2%)
- 462 FCRA, 10 Class Action (2.2%)
Litigation Summary (scroll down for CFPB data):
- Of those cases, there were about 791 unique plaintiffs (including multiple plaintiffs in one suit).
- Of those plaintiffs, about 322, or (41%), had sued under consumer statutes before.
- Combined, those plaintiffs have filed about 2907 lawsuits since 2001
- Actions were filed in 146 different US District Court branches.
- About 621 different collection firms and creditors were sued.
The top courts where lawsuits were filed:
- 55 Lawsuits: Georgia Northern District Court – Atlanta
- 41 Lawsuits: Illinois Northern District Court – Chicago
- 28 Lawsuits: Pennsylvania Eastern District Court – Philadelphia
- 26 Lawsuits: Texas Northern District Court – Dallas
- 21 Lawsuits: Florida Middle District Court – Tampa
- 19 Lawsuits: California Central District Court – Western Division – Los Angeles
- 19 Lawsuits: Florida Middle District Court – Orlando
- 19 Lawsuits: Texas Southern District Court – Houston
- 19 Lawsuits: Iowa Southern District Court – Central
- 18 Lawsuits: California Southern District Court – San Diego
The most active consumer attorneys were:
- Representing 23 Consumers: OCTAVIO GOMEZ
- Representing 16 Consumers: JOSEPH POWELL MCCLELLAND
- Representing 13 Consumers: JOEL SPENCER HALVORSEN
- Representing 13 Consumers: NATHAN CHARLES VOLHEIM
- Representing 13 Consumers: MATTHEW THOMAS BERRY
- Representing 9 Consumers: TODD M FRIEDMAN
- Representing 9 Consumers: JOHN THOMAS STEINKAMP
- Representing 9 Consumers: DAVID J PHILIPPS
- Representing 9 Consumers: NKEM AMADI HOUSE
- Representing 9 Consumers: YITZCHAK ZELMAN
Statistics Year to Date:
5688 total lawsuits for 2023, including:
- 2279 FDCPA
- 3152 FCRA
- 1009 TCPA
Number of Unique Plaintiffs for 2023: 5132 (including multiple plaintiffs in one suit)
The most active consumer attorneys of the year:
- Representing 112 Consumers: MATTHEW THOMAS BERRY
- Representing 99 Consumers: OCTAVIO GOMEZ
- Representing 84 Consumers: JOSEPH POWELL MCCLELLAND
- Representing 76 Consumers: CHRISTOPHER NEIL ARMOR
- Representing 72 Consumers: DAVID J PHILIPPS
- Representing 67 Consumers: NATHAN CHARLES VOLHEIM
- Representing 65 Consumers: JOEL SPENCER HALVORSEN
- Representing 64 Consumers: ALLEN EDGAR ROBERTSON
- Representing 59 Consumers: AHREN A TILLER
- Representing 59 Consumers: KYLE W SCHUMACHER
CFPB Complaint Statistics:
There were 5174 complaints filed against debt collectors from Jul 01, 2023 to Jul 31, 2023.
Total number of debt collectors complained about: 750
The types of debt behind the complaints were:
- 1495 Other debt (29%)
- 1408 I do not know (27%)
- 1297 Credit card debt (25%)
- 501 Medical debt (10%)
- 247 Auto debt (5%)
- 95 Payday loan debt (2%)
- 60 Mortgage debt (1%)
- 46 Private student loan debt (1%)
- 25 Federal student loan debt (0%)
Here is a breakdown of complaints:
- 2904 Attempts to collect debt not owed (56%)
- 804 Written notification about debt (16%)
- 522 Took or threatened to take negative or legal action (10%)
- 441 False statements or representation (9%)
- 395 Communication tactics (8%)
- 108 Threatened to contact someone or share information improperly (2%)
The top five subissues were:
- 1440 Debt is not yours (28%)
- 986 Debt was result of identity theft (19%)
- 511 Didnt receive enough information to verify debt (10%)
- 384 Debt was paid (7%)
- 328 Attempted to collect wrong amount (6%)
The top states complaints were filed from are:
- 655 Complaints: TX
- 619 Complaints: FL
- 474 Complaints: CA
- 399 Complaints: GA
- 289 Complaints: NY
- 219 Complaints: IL
- 203 Complaints: NC
- 194 Complaints: PA
- 149 Complaints: OH
- 141 Complaints: MI
The status of the month’s complaints are as follows:
- 3818 Closed with explanation (74%)
- 805 In progress (16%)
- 486 Closed with non-monetary relief (9%)
- 42 Untimely response (1%)
- 23 Closed with monetary relief (0%)
This includes 5087 (98%) timely responses to complaints, and 87 (2%) untimely responses.