Litigation Analysis
Quick analysis: Everything but FCRA down in July
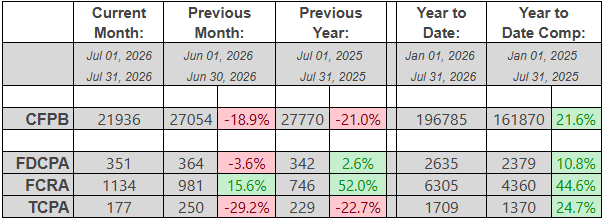
Continuing a trend of mixed results over the last several months, all consumer protection statute filings were down in July except for FCRA, while paradoxically everything is still up by double digits YTD.
TCPA provided the most dramatic change by plummeting (-29.2%) from June, while FDCPA fell a less dramatic (-3.6%) and FCRA jumped up (+15.6%) to be the only increase for the month.
For the year, everything is still up by double digits: TCPA (+24.7%), FDCPA (+10.8%) and FCRA (+44.6%).
CFPB complaints fell from June as well, down (-18.9%) for the month, but still up a healthy (+21.6%) for the year.
In other news, putative class actions represented 7.7% of FDCPA, 61.0% of TCPA (the lowest in recent memory) and 1.2% of FCRA lawsuits filed last month. About 38% of all plaintiffs who filed suit last month had filed at least once before. And finally, South Florida attorney Gerald Lane (from The Law Offices of Jibrael S.Hindi) continued for an eighteenth straight month to represent both the most consumers in July (51) as well as YTD (482).
Complaint Statistics:
21936 consumers filed CFPB complaints, and about 1470 consumers filed lawsuits under consumer statutes from Jul 01, 2026 to Jul 31, 2026.
- 21936 CFPB Complaints
- 351 FDCPA, 27 Class Action (7.7%)
- 177 TCPA, 108 Class Action (61.0%)
- 1134 FCRA, 14 Class Action (1.2%)
Litigation Summary (scroll down for CFPB data):
- Of those cases, there were about 1470 unique plaintiffs (including multiple plaintiffs in one suit).
- Of those plaintiffs, about 559, or (38%), had sued under consumer statutes before.
- Combined, those plaintiffs have filed about 7961 lawsuits since 2001
- Actions were filed in 152 different US District Court branches.
- About 652 different collection firms and creditors were sued.
The top courts where lawsuits were filed:
- 170 Lawsuits: Georgia Northern District Court - Atlanta
- 123 Lawsuits: District Court For The Northern District Of Illinois
- 71 Lawsuits: California Central District Court - Southern Division - Santa Ana
- 71 Lawsuits: California Central District Court - Western Division - Los Angeles
- 61 Lawsuits: Florida Middle District Court - Tampa
- 54 Lawsuits: Michigan Eastern District Court - Detroit
- 50 Lawsuits: Texas Eastern District Court - Sherman
- 36 Lawsuits: Texas Northern District Court - Dallas
- 36 Lawsuits: Texas Western District Court - Austin
- 35 Lawsuits: California Southern District Court - San Diego
The most active consumer attorneys were:
- Representing 51 Consumers: GERALD D LANE
- Representing 43 Consumers: BLAKE R BAUER
- Representing 42 Consumers: HEATHER RENEE HICKS
- Representing 41 Consumers: JONATHAN ALEXANDER HEEPS
- Representing 40 Consumers: ESTHER NNEKA OISE
- Representing 39 Consumers: KURT A OKEEFE
- Representing 37 Consumers: KYLE W SCHUMACHER
- Representing 35 Consumers: CHRISTOPHER FRANK ALLEN
- Representing 31 Consumers: KRISTI CAHOON KELLY
- Representing 30 Consumers: SCOTT EDWIN FERRELL
Statistics Year to Date:
9572 total lawsuits for 2026, including:
- 2635 FDCPA
- 6305 FCRA
- 1709 TCPA
Number of Unique Plaintiffs for 2026: 8245 (including multiple plaintiffs in one suit)
The most active consumer attorneys of the year:
- Representing 482 Consumers: GERALD DONALD LANE
- Representing 162 Consumers: JONATHAN ALEXANDER HEEPS
- Representing 158 Consumers: ESTHER NNEKA OISE
- Representing 141 Consumers: GERALD D LANE
- Representing 135 Consumers: MARK A CAREY
- Representing 131 Consumers: KYLE W SCHUMACHER
- Representing 128 Consumers: JEFF LOHMAN
- Representing 104 Consumers: ZANE CHARLES HEDAYA
- Representing 98 Consumers: OCTAVIO GOMEZ
- Representing 93 Consumers: JOEL S HALVORSEN
——————————————————————————————————-
CFPB Complaint Statistics:
There were 21936 complaints filed against debt collectors from Jul 01, 2026 to Jul 31, 2026.
Total number of debt collectors complained about: 975
The types of debt behind the complaints were:
- 14575 I do not know (66%)
- 2409 Credit card debt (11%)
- 2122 Other debt (10%)
- 967 Telecommunications debt (4%)
- 641 Rental debt (3%)
- 506 Medical debt (2%)
- 372 Auto debt (2%)
- 178 Payday loan debt (1%)
- 68 Private student loan debt (0%)
- 59 Federal student loan debt (0%)
- 39 Mortgage debt (0%)
Here is a breakdown of complaints:
- 10107 Attempts to collect debt not owed (46%)
- 4950 Took or threatened to take negative or legal action (23%)
- 3808 Written notification about debt (17%)
- 1954 False statements or representation (9%)
- 558 Communication tactics (3%)
- 358 Electronic communications (2%)
- 201 Threatened to contact someone or share information improperly (1%)
The top five subissues were:
- 7284 Debt is not yours (33%)
- 4540 Threatened or suggested your credit would be damaged (21%)
- 2573 Didnt receive enough information to verify debt (12%)
- 2154 Debt was result of identity theft (10%)
- 1838 Attempted to collect wrong amount (8%)
The top states complaints were filed from are:
- 4002 Complaints: TX
- 2277 Complaints: FL
- 1688 Complaints: CA
- 1598 Complaints: GA
- 908 Complaints: NC
- 869 Complaints: IL
- 846 Complaints: NY
- 813 Complaints: AZ
- 751 Complaints: PA
- 698 Complaints: AL
The status of the month’s complaints are as follows:
- 12044 Closed with explanation (55%)
- 5308 In progress (24%)
- 4152 Closed with non-monetary relief (19%)
- 419 Untimely response (2%)
- 13 Closed with monetary relief (0%)
This includes 21432 (98%) timely responses to complaints, and 504 (2%) untimely responses.