Litigation Analysis
Quick analysis: Everything up but TCPA
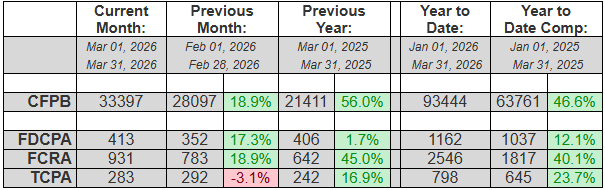
In a complete reversal from February, TCPA (-3.1%) litigation ticked down in March, while FDCPA (+17.3%) and FCRA (+18.9%) both had strong increases. Year-to-date, everything was up though, with TCPA (+23.7%), FDCPA (+12.1%) and FCRA (+40.1%) all still tracking well ahead of the same time in 2025.CFPB complaints were also up for the month (+18.9%) and the year (+46.6%), continuing the rally in the CFPB complaint portal despite the agency pulling back from its strong enforcement of this sector.
In other news, putative class actions represented 6.8% of FDCPA, 77.7% of TCPA and 1.3% of FCRA lawsuits filed last month. TCPA class actions are still extraordinarily high, historically speaking. About 43% of all plaintiffs who filed suit last month had filed at least once before. And finally, South Florida attorney Gerald Lane (from The Law Offices of Jibrael S. Hindi) continued for a 14th straight month to represent both the most consumers in March (115) as well as YTD (267).
Complaint Statistics:
33397 consumers filed CFPB complaints, and about 1358 consumers filed lawsuits under consumer statutes from Mar 01, 2026 to Mar 31, 2026.
- 33397 CFPB Complaints
- 413 FDCPA, 28 Class Action (6.8%)
- 283 TCPA, 220 Class Action (77.7%)
- 931 FCRA, 12 Class Action (1.3%)
Litigation Summary (scroll down for CFPB data):
- Of those cases, there were about 1358 unique plaintiffs (including multiple plaintiffs in one suit).
- Of those plaintiffs, about 583, or (43%), had sued under consumer statutes before.
- Combined, those plaintiffs have filed about 11421 lawsuits since 2001
- Actions were filed in 164 different US District Court branches.
- About 807 different collection firms and creditors were sued.
The top courts where lawsuits were filed:
- 94 Lawsuits: Georgia Northern District Court - Atlanta
- 93 Lawsuits: California Central District Court - Western Division - Los Angeles
- 92 Lawsuits: Illinois Northern District Court - Chicago
- 72 Lawsuits: Florida Middle District Court - Tampa
- 54 Lawsuits: California Central District Court - Southern Division - Santa Ana
- 42 Lawsuits: California Southern District Court - San Diego
- 34 Lawsuits: Florida Southern District Court - Miami
- 31 Lawsuits: New York Eastern District Court - Brooklyn
- 29 Lawsuits: Florida Middle District Court - Orlando
- 29 Lawsuits: New Jersey District Court - Newark
The most active consumer attorneys were:
- Representing 115 Consumers: GERALD DONALD LANE
- Representing 45 Consumers: ZANE CHARLES HEDAYA
- Representing 31 Consumers: MITCHELL DAVID HANSEN
- Representing 24 Consumers: JEFF LOHMAN
- Representing 22 Consumers: KYLE W SCHUMACHER
- Representing 17 Consumers: MARK A CAREY
- Representing 16 Consumers: OCTAVIO GOMEZ
- Representing 16 Consumers: ANTHONY I PARONICH
- Representing 15 Consumers: JONATHAN ALEXANDER HEEPS
Statistics Year to Date:
4001 total lawsuits for 2026, including:
- 1162 FDCPA
- 2546 FCRA
- 798 TCPA
Number of Unique Plaintiffs for 2026: 3589 (including multiple plaintiffs in one suit)
The most active consumer attorneys of the year:
- Representing 267 Consumers: GERALD DONALD LANE
- Representing 97 Consumers: MARK A CAREY
- Representing 79 Consumers: ZANE CHARLES HEDAYA
- Representing 56 Consumers: JEFF LOHMAN
- Representing 49 Consumers: MITCHELL DAVID HANSEN
- Representing 48 Consumers: JONATHAN ALEXANDER HEEPS
- Representing 46 Consumers: OCTAVIO GOMEZ
- Representing 40 Consumers: ESTHER NNEKA OISE
- Representing 40 Consumers: ANTHONY I PARONICH
——————————————————————————————————-
CFPB Complaint Statistics:
There were 33397 complaints filed against debt collectors from Mar 01, 2026 to Mar 31, 2026.
Total number of debt collectors complained about: 1206
The types of debt behind the complaints were:
- 22044 I do not know (66%)
- 3692 Other debt (11%)
- 3527 Credit card debt (11%)
- 1236 Telecommunications debt (4%)
- 1139 Rental debt (3%)
- 730 Medical debt (2%)
- 536 Auto debt (2%)
- 302 Payday loan debt (1%)
- 72 Private student loan debt (0%)
- 71 Federal student loan debt (0%)
- 48 Mortgage debt (0%)
Here is a breakdown of complaints:
- 15903 Attempts to collect debt not owed (48%)
- 7932 Took or threatened to take negative or legal action (24%)
- 4901 Written notification about debt (15%)
- 3301 False statements or representation (10%)
- 795 Communication tactics (2%)
- 366 Electronic communications (1%)
- 199 Threatened to contact someone or share information improperly (1%)
The top five subissues were:
- 9905 Debt is not yours (30%)
- 7438 Threatened or suggested your credit would be damaged (22%)
- 4804 Debt was result of identity theft (14%)
- 3268 Didnt receive enough information to verify debt (10%)
- 3134 Attempted to collect wrong amount (9%)
The top states complaints were filed from are:
- 6021 Complaints: TX
- 3469 Complaints: FL
- 2826 Complaints: GA
- 2624 Complaints: CA
- 1767 Complaints: SC
- 1401 Complaints: NC
- 1178 Complaints: PA
- 1098 Complaints: NY
- 1085 Complaints: IL
- 957 Complaints: AL
The status of the month’s complaints are as follows:
- 22053 Closed with explanation (66%)
- 6318 In progress (19%)
- 4168 Closed with non-monetary relief (12%)
- 826 Untimely response (2%)
- 32 Closed with monetary relief (0%)
This includes 32378 (97%) timely responses to complaints, and 1019 (3%) untimely responses.