Litigation Analysis
Two Turtle Doves and a Lump of Coal
Happy holidays to you and yours!
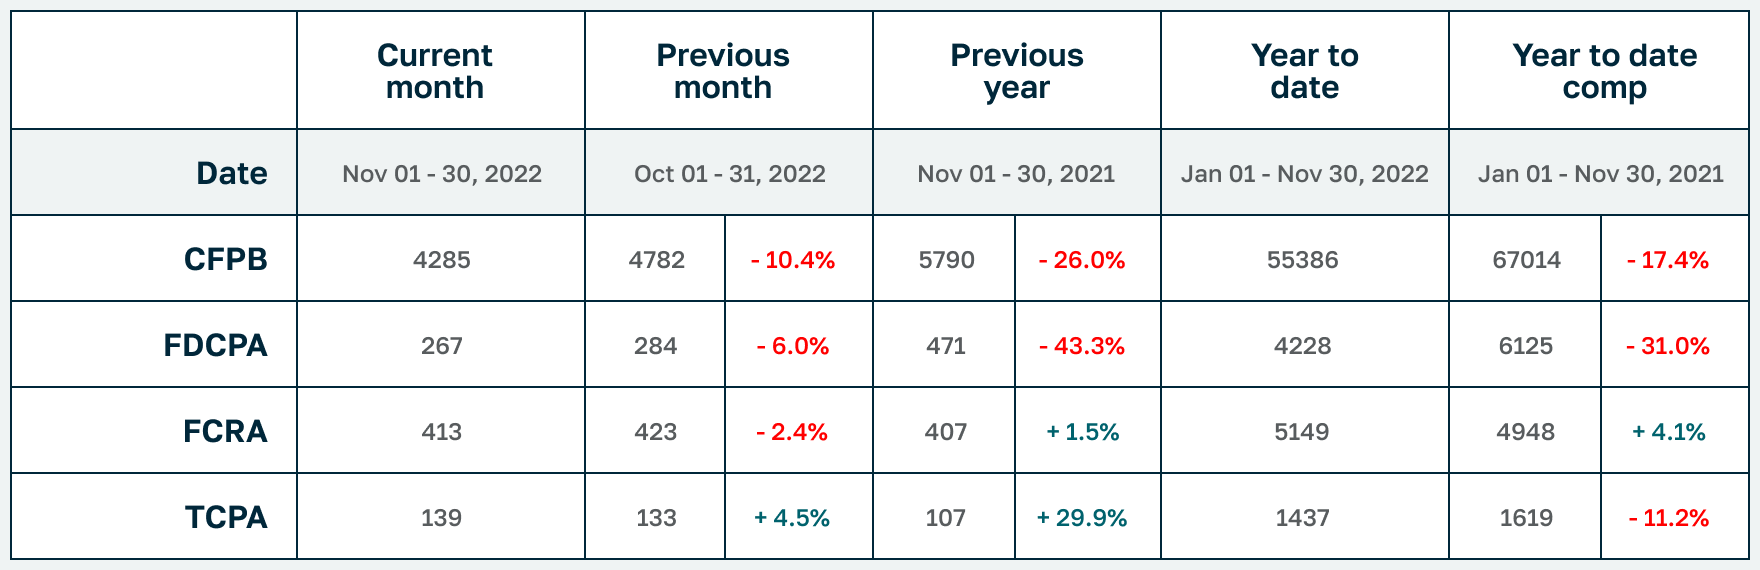
November 2022 was a mixed bag for litigation. FDCPA (-10.4%) and FCRA (-2.4%) lawsuits were both down for the month, but TCPA (+4.5%) lawsuits had a mini (and relatively uncharacteristic) surge. Year-to-date, FDCPA (-31%!) and TCPA (-11.2%) continued year-over-year declines, while FCRA (+4.1%) is still trending up. CFPB complaints were down both for the month (-10.4%) and for the year (-17.4%).
In other news, putative class actions represented 13.9% of FDCPA, 43.2% of TCPA and 1.7% of FCRA lawsuits filed last month. About 44% of all plaintiffs who filed suit last month had filed at least once before. And finally, Minnesota attorney Catrina Eom Smith continued her dominant debut for a third consecutive month on this list for representing the most consumers in November (25) while Florida attorney Jibrael S Hindi has still represented the most consumers for the year so far (235).
Complaint Statistics:
4285 consumers filed CFPB complaints, and about 723 consumers filed lawsuits under consumer statutes from Nov 01, 2022 to Nov 30, 2022.
- 4285 CFPB Complaints
- 267 FDCPA, 37 Class Action (13.9%)
- 139 TCPA, 60 Class Action (43.2%)
- 413 FCRA, 7 Class Action (1.7%)
Litigation Summary (scroll down for CFPB data):
- Of those cases, there were about 723 unique plaintiffs (including multiple plaintiffs in one suit).
- Of those plaintiffs, about 319, or (44%), had sued under consumer statutes before.
- Combined, those plaintiffs have filed about 2455 lawsuits since 2001
- Actions were filed in 142 different US District Court branches.
- About 503 different collection firms and creditors were sued.
The top courts where lawsuits were filed:
- 45 Lawsuits: Minnesota District Court – Dmn
- 43 Lawsuits: Illinois Northern District Court – Chicago
- 41 Lawsuits: Florida Middle District Court – Tampa
- 34 Lawsuits: Georgia Northern District Court – Atlanta
- 33 Lawsuits: Pennsylvania Eastern District Court – Philadelphia
- 27 Lawsuits: Texas Northern District Court – Dallas
- 25 Lawsuits: California Central District Court – Western Division – Los Angeles
- 21 Lawsuits: California Southern District Court – San Diego
- 19 Lawsuits: Florida Southern District Court – Miami
- 16 Lawsuits: Texas Southern District Court – Houston
The most active consumer attorneys were:
- Representing 25 Consumers: CATRINA EOM SMITH
- Representing 19 Consumers: YAAKOV SAKS
- Representing 14 Consumers: MATTHEW THOMAS BERRY
- Representing 12 Consumers: AHREN A TILLER
- Representing 11 Consumers: TIMOTHY S ANDERSON
- Representing 10 Consumers: NATHAN CHARLES VOLHEIM
- Representing 9 Consumers: ALLEN EDGAR ROBERTSON
- Representing 9 Consumers: DAVID J PHILIPPS
- Representing 8 Consumers: GLORIA CHI-KI LAM
- Representing 8 Consumers: GERARDO AVALOS
Statistics Year to Date:
9987 total lawsuits for 2022, including:
- 4228 FDCPA
- 5149 FCRA
- 1437 TCPA
Number of Unique Plaintiffs for 2022: 8735 (including multiple plaintiffs in one suit)
The most active consumer attorneys of the year:
- Representing 235 Consumers: JIBRAEL JARALLAH SAID HINDI
- Representing 216 Consumers: MATTHEW THOMAS BERRY
- Representing 205 Consumers: THOMAS JOHN PATTI
- Representing 143 Consumers: CRAIG CARLEY MARCHIANDO
- Representing 133 Consumers: LEONARD ANTHONY BENNETT
- Representing 129 Consumers: MICHAEL FREDERICK CARDOZA
- Representing 129 Consumers: CATRINA EOM SMITH
- Representing 128 Consumers: CHRISTOPHER NEIL ARMOR
- Representing 125 Consumers: SYED HASEEB HUSSAIN
- Representing 119 Consumers: DREW DAVID SARRETT
CFPB Complaint Statistics:
There were 4285 complaints filed against debt collectors from Nov 01, 2022 to Nov 30, 2022.
Total number of debt collectors complained about: 748
The types of debt behind the complaints were:
- 1247 Other debt (29%)
- 1025 I do not know (24%)
- 957 Credit card debt (22%)
- 651 Medical debt (15%)
- 210 Auto debt (5%)
- 73 Mortgage debt (2%)
- 68 Payday loan debt (2%)
- 30 Private student loan debt (1%)
- 24 Federal student loan debt (1%)
Here is a breakdown of complaints:
- 2295 Attempts to collect debt not owed (54%)
- 694 Written notification about debt (16%)
- 505 Took or threatened to take negative or legal action (12%)
- 388 False statements or representation (9%)
- 323 Communication tactics (8%)
- 80 Threatened to contact someone or share information improperly (2%)
The top five subissues were:
- 1188 Debt is not yours (28%)
- 692 Debt was result of identity theft (16%)
- 441 Didnt receive enough information to verify debt (10%)
- 356 Debt was paid (8%)
- 286 Attempted to collect wrong amount (7%)
The top states complaints were filed from are:
- 489 Complaints: TX
- 470 Complaints: FL
- 386 Complaints: CA
- 337 Complaints: GA
- 236 Complaints: IL
- 215 Complaints: NY
- 201 Complaints: NC
- 138 Complaints: MI
- 130 Complaints: PA
- 125 Complaints: OH
The status of the month’s complaints are as follows:
- 3285 Closed with explanation (77%)
- 647 In progress (15%)
- 293 Closed with non-monetary relief (7%)
- 49 Untimely response (1%)
- 11 Closed with monetary relief (0%)
This includes 4160 (97%) timely responses to complaints, and 125 (3%) untimely responses.