Complaint Statistics:
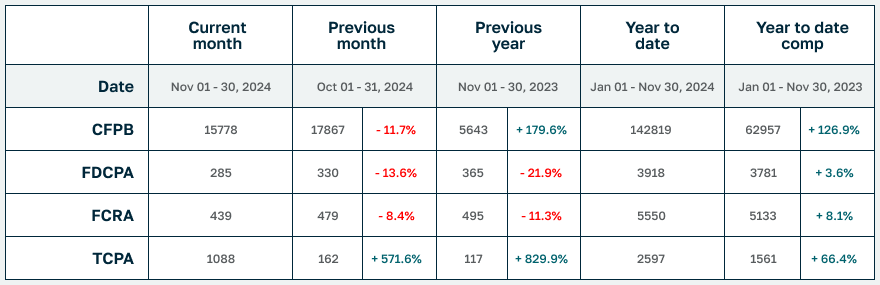
15778 consumers filed CFPB complaints, and about 1665 consumers filed lawsuits under consumer statutes from Nov 01, 2024 to Nov 30, 2024.
- 15778 CFPB Complaints
- 285 FDCPA, 31 Class Action (10.9%)
- 1088 TCPA, 1039 Class Action (95.5%)
- 439 FCRA, 5 Class Action (1.1%)
Litigation Summary (scroll down for CFPB data):
- Of those cases, there were about 1665 unique plaintiffs (including multiple plaintiffs in one suit).
- Of those plaintiffs, about 1020, or (61%), had sued under consumer statutes before.
- Combined, those plaintiffs have filed about 6723 lawsuits since 2001
- Actions were filed in 141 different US District Court branches.
- About 517 different collection firms and creditors were sued.
The top courts where lawsuits were filed:
- 57 Lawsuits: Georgia Northern District Court – Atlanta
- 33 Lawsuits: Florida Middle District Court – Tampa
- 29 Lawsuits: Illinois Northern District Court – Chicago
- 27 Lawsuits: California Central District Court – Western Division – Los Angeles
- 25 Lawsuits: California Southern District Court – San Diego
- 24 Lawsuits: Indiana Southern District Court – Indianapolis
- 23 Lawsuits: Alabama Northern District Court – Southern
- 21 Lawsuits: Pennsylvania Eastern District Court – Philadelphia
- 21 Lawsuits: Texas Northern District Court – Dallas
- 20 Lawsuits: New York Eastern District Court – Brooklyn
The most active consumer attorneys were:
- Representing 941 Consumers: JAMES S WERTHEIM
- Representing 941 Consumers: MITCHELL D WEST
- Representing 941 Consumers: CRYSTAL L COOKE
- Representing 941 Consumers: REBECCA EVANS
- Representing 941 Consumers: THOMAS WILLIAM ALVORD
- Representing 19 Consumers: MATTHEW THOMAS BERRY
- Representing 18 Consumers: DAVID J PHILIPPS
- Representing 16 Consumers: JOHN G WATTS
- Representing 15 Consumers: CHRISTOPHER NEIL ARMOR
- Representing 15 Consumers: TODD M FRIEDMAN
Statistics Year to Date:
9456 total lawsuits for 2024, including:
- 3918 FDCPA
- 5550 FCRA
- 2597 TCPA
Number of Unique Plaintiffs for 2024:
9550 (including multiple plaintiffs in one suit)
The most active consumer attorneys of the year:
- Representing 942 Consumers: THOMAS WILLIAM ALVORD
- Representing 942 Consumers: JAMES S WERTHEIM
- Representing 941 Consumers: REBECCA EVANS
- Representing 941 Consumers: MITCHELL D WEST
- Representing 941 Consumers: CRYSTAL L COOKE
- Representing 259 Consumers: OCTAVIO GOMEZ
- Representing 128 Consumers: MATTHEW THOMAS BERRY
- Representing 127 Consumers: MELKON RAFI MELKONIAN
- Representing 127 Consumers: ZAREH JACK KOUSIAN
- Representing 127 Consumers: HAROUT GREG KEOSIAN
CFPB Complaint Statistics:
There were 15778 complaints filed against debt collectors from Nov 01, 2024 to Nov 30, 2024.
Total number of debt collectors complained about: 927
The types of debt behind the complaints were:
- 9033 I do not know (57%)
- 2174 Credit card debt (14%)
- 1993 Other debt (13%)
- 731 Telecommunications debt (5%)
- 617 Rental debt (4%)
- 520 Medical debt (3%)
- 405 Auto debt (3%)
- 158 Payday loan debt (1%)
- 55 Federal student loan debt (0%)
- 52 Mortgage debt (0%)
- 40 Private student loan debt (0%)
Here is a breakdown of complaints:
- 6175 Attempts to collect debt not owed (39%)
- 3820 False statements or representation (24%)
- 3543 Written notification about debt (22%)
- 1366 Took or threatened to take negative or legal action (9%)
- 553 Communication tactics (4%)
- 198 Electronic communications (1%)
- 123 Threatened to contact someone or share information improperly (1%)
The top five subissues were:
- 3720 Debt is not yours (24%)
- 3666 Attempted to collect wrong amount (23%)
- 1720 Debt was result of identity theft (11%)
- 1693 Notification didnt disclose it was an attempt to collect a debt (11%)
- 1117 Didnt receive enough information to verify debt (7%)
The top states complaints were filed from are:
- 2780 Complaints: TX
- 1700 Complaints: FL
- 1464 Complaints: GA
- 1220 Complaints: CA
- 731 Complaints: IL
- 676 Complaints: NY
- 558 Complaints: PA
- 480 Complaints: SC
- 470 Complaints: NC
- 456 Complaints: MI
The status of the month’s complaints are as follows:
- 10932 Closed with explanation (69%)
- 4106 Closed with non-monetary relief (26%)
- 572 In progress (4%)
- 138 Untimely response (1%)
- 30 Closed with monetary relief (0%)
This includes 15470 (98%) timely responses to complaints, and 308 (2%) untimely responses.